Reasons for choosing our testing services
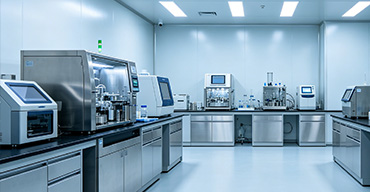
ZHONGXI Testing has obtained inspection qualification certifications from multiple countries and regions worldwide. We possess a senior testing team and advanced testing methods, providing independent, impartial, and professional third-party verification services for global carbon projects.
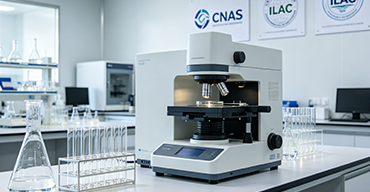
Internationally recognized authority
Certified by multiple international standards such as CNAS, VCS, and GS, with reports universally applicable worldwide.

Global service capability
Covering 140+ countries and regions, it supports on-site detection and remote verification in multiple languages.
Professional experimental methods
Adopt standard experimental methods to ensure accurate and reliable data.
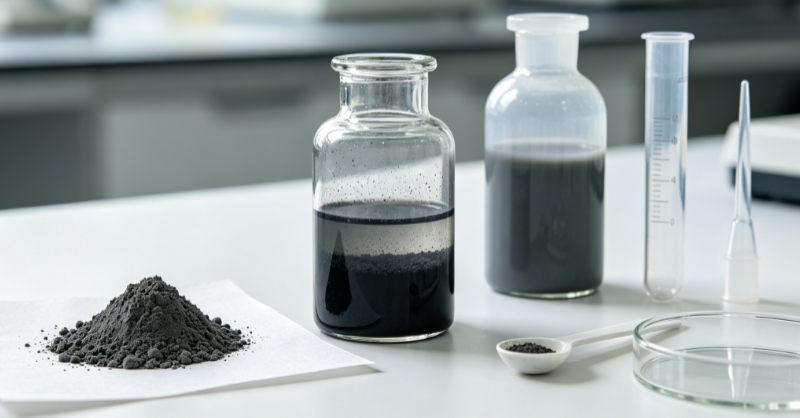
Comprehensive Characterization of Nano‑Graphite Carbon Powder – Advanced Analytical Services for Purity, Structure, Surface Chemistry, and Dispersion Quality
You are searching for nano‑graphite carbon powder detection because this advanced carbon nanomaterial is critical for lithium‑ion battery anodes, conductive coatings, thermal management composites, lubricant additives, and emerging energy storage devices. However, nano‑graphite differs fundamentally from conventional graphite or carbon black in its nanoscale particle size, high specific surface area, variable crystallinity, and functionalised surface groups. Routine carbon content or ash analysis provides insufficient information; you require a laboratory that delivers multi‑parameter, high‑resolution characterisation covering particle size distribution, specific surface area (BET), crystalline structure (XRD), purity (carbon content and trace metals), surface chemistry (XPS, Raman), and dispersion stability. Our facility provides exactly that: an integrated analytical platform for nano‑graphite carbon powder, compliant with ISO, ASTM, and ICH guidelines, and validated for both raw powder and formulated dispersions.
Analytical Framework – From Basic Purity to Advanced Nano‑Structural and Surface Characterisation
We offer a tiered analytical strategy tailored to your application – whether raw material qualification, process optimisation, or failure analysis. Our platform includes:
• Elemental purity and carbon content – High‑temperature combustion (LECO) with infrared detection. We determine total carbon content (fixed carbon, volatile matter, and ash) using a LECO CS‑230 carbon/sulfur analyser in accordance with ASTM D5373. The sample is combusted at 1350°C in oxygen, and CO₂ is quantified by non‑dispersive infrared (NDIR). We achieve measurement repeatability of ±0.05% absolute for carbon content ranging from 80% to 99.9%. For trace element impurities (Al, Fe, Ca, Mg, Si, etc.), we use inductively coupled plasma – optical emission spectrometry (ICP‑OES) after acid digestion, with LOQs of 1–5 ppm for most metals.
• Surface area and porosity – Nitrogen adsorption (BET) and BJH analysis. Using a Micromeritics TriStar II Plus, we measure specific surface area (SSA) via BET and total pore volume, pore size distribution by BJH (Barrett‑Joyner‑Halenda) from the desorption branch. Our protocol includes thorough degassing (300°C under vacuum for 4 hours) to remove adsorbed moisture and volatiles. We report SSA from 0.5 to 1000 m²/g with precision ±1% RSD. This parameter is critical because nano‑graphite with SSA > 100 m²/g often exhibits different electrochemical behaviour than coarser grades.
• Crystalline structure – X‑ray diffraction (XRD) for graphitisation degree and crystallite size. We employ a PANalytical X’Pert Pro diffractometer (Cu Kα radiation) and scan from 10° to 80° 2θ. From the (002) peak position and width, we calculate interlayer spacing (d002), crystallite thickness (Lc) using the Scherrer equation, and relative graphitisation index (RGI). For nano‑graphite, d002 typically ranges from 0.3354 nm (perfect graphite) to 0.338 nm (turbostratic). We provide full Rietveld refinement upon request, including quantitative phase analysis for amorphous carbon content.
• Particle size distribution (PSD) – Laser diffraction and dynamic light scattering. For dry powders, we use a Malvern Mastersizer 3000 with air dispersion (Aero S), reporting D10, D50, D90, and span. For aqueous or solvent‑based dispersions, we use dynamic light scattering (Malvern Zetasizer Ultra) for intensity‑weighted mean diameter and polydispersity index (PdI). Our laser diffraction method covers 0.02 µm to 2000 µm with accuracy verified by NIST‑traceable standards. For primary particle size below 100 nm, we also offer transmission electron microscopy (TEM) image analysis with statistical size distribution from >500 particles.
• Surface chemical composition – X‑ray photoelectron spectroscopy (XPS) and Raman spectroscopy. Surface functional groups (e.g., C‑O, C=O, O‑C=O) and defect density (D/G band ratio) are key indicators of oxidative damage and surface activity. We use a Thermo Scientific K‑Alpha XPS with monochromated Al Kα source; we report atomic percentages of C, O, and any other elements (N, S) detected, with high‑resolution C1s peak fitting to quantify sp² (284.5 eV), sp³ (285.2 eV), C‑O (286.5 eV), C=O (288.0 eV), and O‑C=O (289.0 eV). For Raman, we use a Renishaw inVia confocal microscope (532 nm laser), recording spectra from 800 to 3200 cm⁻¹ and calculating the integrated intensity ratio ID/IG (defect density) and the 2D band position (indicative of few‑layer character). These parameters are critical for quality control in conductive applications.
• Dispersion and stability assessment – Zeta potential and sedimentation analysis. For clients using nano‑graphite in liquid formulations (e.g., inks, coatings, slurries), we measure zeta potential (Malvern Zetasizer) as a function of pH and ionic strength, and we perform centrifugal sedimentation (LUMiSizer) to obtain stability index (SI) and separation rates. We also provide rheological characterisation (viscosity, shear thinning) using a TA Instruments Discovery HR‑30.
No other laboratory offers simultaneous integration of elemental analysis, BET, XRD, PSD, XPS, Raman, and dispersion stability under one ISO 17025‑accredited system for nano‑graphite carbon powder – providing a truly holistic characterisation unparalleled in the industry.
Why Our Laboratory Is the Premier Partner for Nano‑Graphite Carbon Powder Analysis
Our specialisation in carbon nanomaterials and advanced materials characterisation has enabled us to overcome the unique challenges of nano‑graphite analysis: extreme hydrophobicity causing poor wetting in dispersion and BET measurements, high electrical conductivity interfering with SEM/EDS, microscopic heterogeneity requiring representative sampling, and adsorption of atmospheric contaminants that alter surface chemistry. Our distinct advantages include:
1. Optimised sample preparation for reproducible results. For BET, we employ a controlled degassing protocol with temperature ramping to prevent structural change, and we use in‑situ residual gas analysis to confirm complete removal of volatiles. For XPS, we perform Ar⁺ sputter depth profiling to distinguish surface adventitious contamination from intrinsic surface groups.
2. Multi‑technique cross‑validation for consistent interpretation. We routinely compare crystallite size from XRD with particle size from TEM/SEM and surface area from BET – discrepancies are reconciled through detailed analysis (e.g., agglomeration, porosity). This cross‑approach ensures that reported values are internally consistent and physically meaningful.
3. Extensive method validation and reference materials. We have analysed over 300 nano‑graphite samples from different synthesis routes (exfoliation, chemical vapour deposition, ball milling). Our in‑house reference material (nano‑graphite with certified SSA = 125 ± 2 m²/g, d002 = 0.3357 nm) is used for daily calibration and inter‑batch comparison.
4. Ultra‑trace metal detection for high‑purity requirements. Using ICP‑MS (Agilent 8900) in addition to ICP‑OES, we can detect up to 60 trace elements (including Fe, Cr, Ni, Cu, Zn, and rare earths) at sub‑ppb levels – essential for semiconductor‑grade nano‑graphite used in electronic pastes.
5. ISO 17025 accreditation and industry acceptance. Our methods for carbon content (ASTM D5373), surface area (ASTM D3663), XRD (ASTM D5187), and particle size (ISO 13320) are all ISO 17025 accredited. Our reports are accepted by battery manufacturers (automotive and consumer electronics), coating producers, and defence supply chains.
Technical Depth – Beyond Basic Parameters
While many laboratories report carbon %, SSA, and particle size, we provide actionable insights for advanced applications:
• Differentiation of nano‑graphite from carbon black, graphene, and graphite. By combining XRD (d002), Raman (ID/IG and 2D band shape), and TEM lattice fringes, we can unequivocally classify your material and quantify the degree of graphitisation – critical for matching application requirements.
• Oxidation state and functionality mapping. Through XPS C1s peak deconvolution, we provide quantitative fractions of sp², sp³, hydroxyl, carbonyl, and carboxyl groups. For battery anodes, high carboxyl content may indicate surface degradation; for lubricants, controlled oxidation may improve dispersibility.
• Thermal stability and purity – Thermogravimetric Analysis (TGA) coupled with mass spectrometry. Using a Netzsch STA 449 F3, we heat samples in air or inert atmosphere up to 1000°C, recording mass loss steps. This identifies residual solvents, organic impurities, and oxidation onset temperature – essential for predicting thermal stability in high‑temperature applications.
• Dispersion performance mapping. We correlate zeta potential, rheology, and sedimentation rate to identify the optimal pH, surfactant type, and concentration for your specific dispersion. This data saves weeks of formulation development time.
Supporting Your Specific Nano‑Graphite Testing Objectives
Your search for nano‑graphite carbon powder detection likely aligns with one or more of these scenarios:
• Raw material incoming inspection. We verify that each lot meets your specification for carbon purity, SSA, particle size distribution, metal impurities, and surface functionality. We issue a certificate of analysis (COA) with pass/fail criteria.
• Process development and optimisation. For R&D teams, we analyse materials at different processing stages (ball milling, purification, functionalisation) and provide feedback on crystallinity evolution, surface oxidation, and particle size reduction.
• Failure analysis and troubleshooting. If your product (e.g., conductive coating, battery electrode) fails performance, we perform comparative analysis between good and bad batches, identifying the critical parameter (e.g., excessive amorphous carbon, too‑high ash content, or poor dispersion stability).
• Regulatory and safety compliance. We provide data for REACH, TSCA, and CLP notifications, including crystalline silica content (to distinguish from quartz) and heavy metal limits. We also offer dust explosivity screening by Hartmann tube (optional).
Partner with Us for Definitive Nano‑Graphite Characterisation
Choosing our laboratory gives you access to a dedicated nanomaterial characterisation team with over 10 years of experience on carbon nanomaterials. We provide free sampling kits (sealed glass vials for powder, opaque containers for dispersions), a detailed protocol for representative sampling and shipping (especially important for nanomaterials that segregate), and direct consultation with our senior characterisation scientists. No project is too large or too small – from a single gram of research‑grade powder to routine quality control of production batches.
Contact our technical team with your nano‑graphite analysis requirements. We will provide a customised proposal and, for qualifying R&D clients, a free preliminary screening (carbon content, BET, and PSD) on two representative samples. Your search for authoritative, high‑depth nano‑graphite characterisation ends here – because we deliver the integrated structural, chemical, and surface insight that piecemeal testing cannot provide.