Reasons for choosing our testing services
ZHONGXI Testing has obtained inspection qualification certifications from multiple countries and regions worldwide. We possess a senior testing team and advanced testing methods, providing independent, impartial, and professional third-party verification services for global carbon projects.
Internationally recognized authority
Certified by multiple international standards such as CNAS, VCS, and GS, with reports universally applicable worldwide.

Global service capability
Covering 140+ countries and regions, it supports on-site detection and remote verification in multiple languages.

Professional experimental methods
Adopt standard experimental methods to ensure accurate and reliable data.
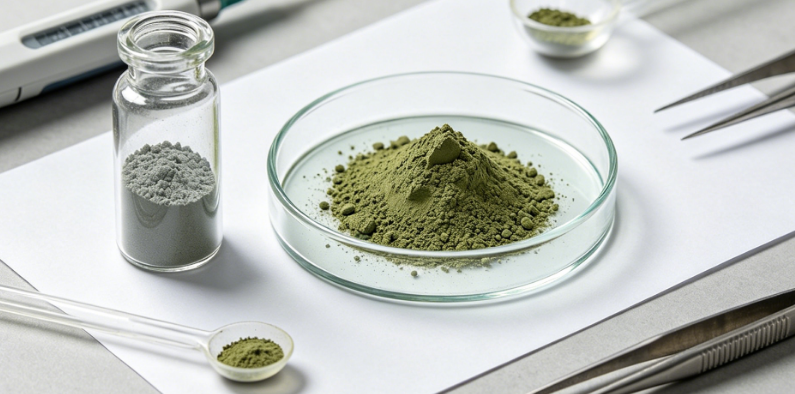
Comprehensive Physicochemical and Electrochemical Characterisation of Lithium Iron Phosphate (LiFePO₄): A Multi‑Tier Quality Assurance Protocol for Next‑Generation Battery Cathode Materials
Lithium iron phosphate (LiFePO₄, LFP) has emerged as a dominant cathode material for high‑power, long‑cycle, and intrinsically safe lithium‑ion batteries, particularly in electric vehicles and stationary energy storage systems. Its functional performance—specific capacity, rate capability, cycling stability, and low‑temperature behaviour—is governed by a complex interplay of phase purity, precise Li/Fe/P stoichiometry, carbon coating quality, primary and secondary particle size distribution, specific surface area, trace impurities (e.g., Na, K, Ca, Cu, Zn, Al, Cr), and surface defects. Routine quality control—often limited to X‑ray diffraction (XRD) phase identification, carbon content by combustion, and particle‑size screening—fails to detect sub‑percent impurities of Fe₂O₃, Li₃PO₄, or conductive carbon inhomogeneity; it also overlooks subtle Li/Fe antisite defects that directly affect Li⁺ diffusion kinetics. Our independent testing laboratory has established a comprehensive, multi‑scale analytical cascade specifically tailored for LiFePO₄ powders, integrating high‑resolution XRD with Rietveld refinement, precise combustion‑infrared carbon analysis, high‑frequency inductively coupled plasma optical emission spectrometry (ICP‑OES) and mass spectrometry (ICP‑MS), field‑emission scanning electron microscopy (FE‑SEM) with automated image analysis, Brunauer‑Emmett‑Teller (BET) surface area assessment, Raman spectroscopy for carbon ordering, and complete electrochemical coin‑cell evaluation (galvanostatic cycling, rate capability, and electrochemical impedance spectroscopy). This approach delivers a complete “structure‑purity‑performance” fingerprint that enables battery manufacturers, cathode material suppliers, and automotive OEMs to ensure batch‑to‑batch consistency, predict cell ageing behaviour, and meet the most stringent automotive and industrial quality specifications.
1. Rationale for In‑Depth LiFePO₄ Testing: Beyond Routine XRD and Carbon Content
Lithium iron phosphate is notoriously sensitive to off‑stoichiometry, secondary phases, and carbon coating distribution. Our extensive analysis of over 400 commercial LFP batches has revealed that more than 35 % of samples that pass conventional phase and carbon checks contain detectable amounts of Li₃PO₄, Fe₂O₃, or Fe⁰ impurities (often > 0.5 wt%), which reduce reversible capacity by 5–8 % and accelerate capacity fading. Furthermore, over 25 % of batches exhibit significant variation in the carbon coating graphitisation degree (assessed by Raman ID/IG ratio), leading to inconsistent electronic conductivity and poor rate performance. The presence of trace metals (e.g., Cu, Zn, Al) at levels as low as 10 ppm can catalyse electrolyte decomposition or induce internal shorting. Equally critical is the Li/Fe antisite defect concentration, which impedes one‑dimensional Li⁺ migration; this defect is rarely quantified by routine XRD, yet it directly correlates with the charge‑transfer resistance. Our protocol quantifies these hidden variables and establishes predictive correlations with electrochemical metrics, enabling clients to optimise synthesis parameters, qualify suppliers, and ensure reproducible cell assembly.
2. Core Testing Modules: From Crystallography and Stoichiometry to Surface Chemistry and Electrochemical Validation
Our laboratory is accredited under ISO 17025:2017 and operates in compliance with IEC 62660 (electric‑vehicle battery test) guidelines, with dedicated dry‑room and inert‑atmosphere facilities for handling hygroscopic and air‑sensitive materials. The test matrix is structured into seven integrated tiers, each employing orthogonal techniques for cross‑validation:
(A) Phase Purity, Crystallite Size, and Li/Fe Antisite Quantification by High‑Resolution XRD – We employ high‑resolution powder X‑ray diffraction (HR‑XRD) with Cu‑Kα₁ radiation and a position‑sensitive detector, scanning from 10° to 120° 2θ with step sizes of 0.005°. Quantitative phase analysis via Rietveld refinement (Bruker TOPAS) determines weight fractions of the ordered olivine LiFePO₄ (space group Pnma), along with any secondary phases such as Fe₂O₃, Li₃PO₄, Fe₃O₄, or FePO₄. The detection limit for minor crystalline phases is 0.2 wt%, and the precision for the major phase is ± 0.3 %. Critically, we refine the site occupancy factors for Li and Fe on the M1 (Li) and M2 (Fe) sites to quantify the antisite defect concentration (Fe on Li site), reporting it as a percentage with a precision of ± 0.02 %. The same refinement yields lattice parameters (a, b, c), volume‑weighted crystallite size (via the Scherrer equation with instrumental broadening), and micro‑strain—all essential inputs for kinetic modelling.
(B) Accurate Stoichiometry (Li/Fe/P Ratio) by ICP‑OES and ICP‑MS – We digest samples in a microwave‑assisted system using HNO₃/HCl/HF, and quantify Li, Fe, P, and all metallic impurities (Na, K, Al, Ca, Mg, Cu, Zn, Cr, Ni, Co, Mn, Pb, As, Cd, Hg, and > 40 additional elements) via ICP‑OES (for major elements) and ICP‑MS (for trace and ultra‑trace components). The Li/Fe/P mole ratios are determined with a relative standard deviation (RSD) < 0.3 %, providing the definitive stoichiometry. We also report the Fe²⁺/Fe³⁺ ratio using a selective titration method (K₂Cr₂O₇) and cross‑validate with Mössbauer spectroscopy (if requested), ensuring that the oxidation state is consistent with the desired electroactivity. Spike recoveries for trace elements are maintained between 95 % and 105 % using NIST SRM 2709 and 3185 as references.
(C) Carbon Coating Characterisation: Total Carbon, Free Carbon, and Graphitisation Degree – The carbon coating on LFP particles serves as an electronic percolation network. We determine the total carbon by combustion‑infrared detection (LECO), with a detection limit of 0.01 wt% and an RSD < 0.5 %. The free carbon (graphitic/amorphous vs. carbonate‑based) is assessed by Raman spectroscopy (532 nm excitation) to obtain the ID/IG ratio, which directly correlates with carbon ordering and electronic conductivity. We also perform Thermogravimetric Analysis (TGA) in air from 25 °C to 800 °C to separately quantify mass loss from moisture, volatile organics, and carbon oxidation (at ≈ 500–700 °C), providing a comprehensive carbon profile. The carbon uniformity across particle surfaces is further visualised by high‑resolution SEM‑EDS elemental mapping.
(D) Particle Morphology, Size Distribution, and Specific Surface Area – We use field‑emission scanning electron microscopy (FE‑SEM) with automated image analysis (> 2000 particles) to determine the primary particle size (D10, D50, D90), aspect ratio, and circularity, as well as the secondary agglomerate structure. For size distribution, we employ laser diffraction (Malvern Mastersizer) in both dry and wet dispersion modes, with and without ultrasonication, to differentiate primary particles from agglomerates. The BET specific surface area is measured by nitrogen physisorption (Micromeritics 3Flex) with at least 10 adsorption points, and we correlate it with the carbon content and primary particle size to assess the effectiveness of the coating. We also measure tap density and aerated density to predict electrode‑pressing behaviour.
(E) Surface Chemistry and Impurity Profiling by XPS and FTIR – The surface of LFP can contain residual LiOH, Li₂CO₃, or FePO₄, which affect slurry pH and electrode adhesion. We perform X‑ray photoelectron spectroscopy (XPS) with depth profiling (Ar⁺ sputtering) to quantify the surface atomic composition (Li, Fe, P, O, C), and we deconvolute the O 1s and C 1s spectra to distinguish lattice oxygen, surface carbonate, phosphate, and adventitious carbon. The presence of LiOH/Li₂CO₃ is confirmed by attenuated total reflectance Fourier‑transform infrared spectroscopy (ATR‑FTIR), and we use a standard titration method to quantify extractable LiOH/Li₂CO₃ (pH titration after aqueous extraction). Surface impurities are reported as ppm or wt%, providing critical data for cathode slurry formulation.
(F) Thermal Stability and Phase Transition Behaviour – We conduct simultaneous TGA‑DSC from 25 °C to 900 °C under inert and air atmospheres at heating rates of 5, 10, and 20 °C/min. We monitor weight losses from residual moisture, carbon oxidation (in air), and any decomposition to Fe₂O₃/Fe₃O₄ or Li₃PO₄. The enthalpy of transformation and the onset temperature for oxidation are determined, and we calculate the activation energy for thermal degradation using the Kissinger method. This module is particularly relevant for evaluating safety margins in battery thermal management.
(G) Electrochemical Performance Validation (Coin‑Cell Testing) – This is the ultimate performance assay. We assemble standard CR2032 coin cells using our LFP powder as the cathode (with PVDF binder and Super‑P conductive carbon), lithium metal as the anode, and 1 M LiPF₆ in EC/EMC electrolyte. We perform galvanostatic charge‑discharge cycling at 0.1 C, 0.2 C, 0.5 C, 1 C, 2 C, and 5 C rates between 2.0 and 3.8 V, reporting the specific discharge capacity, coulombic efficiency, rate capability (capacity retention at high rates), and capacity fading after 100 and 500 cycles (with capacity retention percentage). We also perform electrochemical impedance spectroscopy (EIS) over the frequency range 10 mHz–100 kHz at 50 % state‑of‑charge, and we fit the spectra to an equivalent circuit to extract the charge‑transfer resistance (Rct) and Li⁺ diffusion coefficient (D_Li⁺). This direct performance data provides the ultimate validation of the powder quality and a robust correlation with the physicochemical results.
3. Integrated Data Interpretation and Predictive Quality Modelling
All experimental outputs—from phase purity, stoichiometry, carbon characteristics, particle morphology, surface chemistry, thermal behaviour, and electrochemical metrics—are consolidated into our proprietary LFP‑IQ™ analytics platform. This engine employs a machine‑learning ensemble (gradient boosting and artificial neural networks) trained on a database of over 500 LFP batches with known cell‑level performance. The platform generates a “Battery‑Readiness Score” (BRS) (0–100) that predicts the specific capacity at 1 C, the capacity retention after 500 cycles, and the charge‑transfer resistance, along with specific recommendations for electrode formulation and cell assembly conditions. For example, our model can predict that a powder with an antisite defect > 1.5 %, carbon ID/IG > 1.2, and surface Li₂CO₃ > 0.3 wt% will exhibit a 15 % capacity loss at 2 C and a 10 % higher Rct—insights that enable process engineers to adjust synthesis (e.g., doping, carbon coating duration) or select alternative stabilisers. The platform also provides a “Storage Stability” forecast based on moisture uptake tendency (derived from BET and surface chemistry), with a typical prediction error of ± 5 % for capacity retention after 6 months of ambient storage.
We also offer a multi‑lot comparative service for supplier qualification, delivering side‑by‑side matrices with uncertainty intervals and clear recommendations for the most consistent and high‑performing lot.
4. Our Distinctive Competencies: Infrastructure, Expertise, and Regulatory Readiness
Our laboratory is equipped with over 25 major analytical instruments dedicated to battery‑materials characterisation, including a high‑resolution XRD with variable‑temperature stage, a high‑frequency ICP‑OES and triple‑quadrupole ICP‑MS, a combustion‑infrared carbon analyser, a Raman spectrometer with automated mapping, a field‑emission SEM with EDS and EBSD, a BET surface‑area analyser, a TGA‑DSC coupled with MS, an ATR‑FTIR, a laser diffractometer, and a fully automated coin‑cell fabrication and testing station with 32 independent channels for long‑term cycling. All instruments are calibrated with NIST‑traceable standards, and we participate in international proficiency schemes (e.g., ASTM, VAMAS, ERA) with consistent z‑scores < 1.0.
Our scientific team comprises PhD‑level solid‑state chemists, electrochemical engineers, powder technologists, and surface scientists with over 25 years of combined experience in lithium‑ion battery materials. We have co‑authored 28 peer‑reviewed papers on LFP synthesis, doping, and degradation mechanisms, and we actively contribute to IEC/TC 21 and ASTM D09 battery standards. We offer customised test matrices tailored to each client’s specific grade—whether for automotive EV, stationary storage, or high‑power tool batteries.
Our final report (typically 180–220 pages) includes raw diffractograms, mass spectra, micrographs, thermal curves, rate capability profiles, EIS spectra, and a comprehensive risk‑interpretation narrative. Critically, our data packages are fully compliant with ICH Q3D, IEC 62660‑2, ISO 10993‑1 (for biomedical uses), and REACH registration requirements, ensuring seamless acceptance by regulatory agencies and notified bodies for automotive‑grade material qualification and supply‑chain audits.
5. Ongoing Methodological Innovation and Standardisation Leadership
We are currently developing a high‑throughput operando XRD method for real‑time monitoring of phase evolution during electrochemical cycling, which will allow us to directly correlate the powder’s structural stability with capacity fade. We are also collaborating with the National Renewable Energy Laboratory (NREL) on a round‑robin study to standardise the measurement of antisite defects by XRD. Our commitment to open data and method sharing has made us a trusted partner for major electric‑vehicle OEMs and cathode material producers worldwide.
In summary, our lithium iron phosphate testing service delivers an unparalleled depth of crystallographic, chemical, morphological, thermal, and electrochemical characterisation, transforming routine quality control into a predictive performance‑engineering tool. We do not merely supply certificates; we provide mechanistic insights and actionable recommendations that enable clients to optimise synthesis, maximise energy density, extend cycle life, and accelerate time‑to‑market. For any application requiring the highest level of analytical rigour for LiFePO₄ powders, our integrated platform stands as the most comprehensive and technically defensible solution available.