Reasons for choosing our testing services
ZHONGXI Testing has obtained inspection qualification certifications from multiple countries and regions worldwide. We possess a senior testing team and advanced testing methods, providing independent, impartial, and professional third-party verification services for global carbon projects.
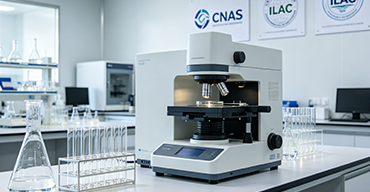
Internationally recognized authority
Certified by multiple international standards such as CNAS, VCS, and GS, with reports universally applicable worldwide.

Global service capability
Covering 140+ countries and regions, it supports on-site detection and remote verification in multiple languages.
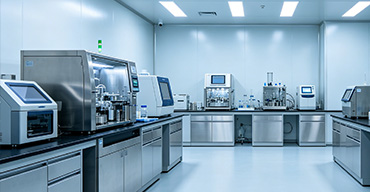
Professional experimental methods
Adopt standard experimental methods to ensure accurate and reliable data.
Comprehensive Multi‑Parameter Characterization of Multi‑Walled Carbon Nanotubes: A Specialized Analytical Service for Industrial Quality Control and Advanced Nanocomposite Development
The unique combination of high electrical conductivity, exceptional mechanical strength, and remarkable thermal stability of multi‑walled carbon nanotubes (MWCNTs) has driven their widespread adoption in conductive polymers, structural composites, energy storage devices, and sensor technologies. However, the actual performance of MWCNTs is critically dependent on a complex set of intrinsic and extrinsic parameters, including wall number, outer/inner diameter distribution, length, crystallinity, defect density, purity (metal catalyst residues and amorphous carbon), and surface functionalization degree. Clients seeking testing for MWCNTs are often confronted with batch‑to‑batch variability, inconsistent supplier specifications, or the need to correlate structural metrics with final application properties. Our laboratory has established a fully integrated, multi‑scale analytical pipeline that transcends routine Raman and TEM assessments, delivering a statistically robust, application‑oriented fingerprint that covers everything from atomic‑scale lattice defects to macroscopic agglomerate behavior, all under a strict quality management framework.
High‑Resolution Electron Microscopy and Dimensional Metrology
Accurate dimensional characterization is fundamental, yet conventional TEM often suffers from limited sampling statistics. We employ a combination of scanning electron microscopy (SEM) at low accelerating voltages for rapid large‑area inspection and high‑resolution transmission electron microscopy (HR‑TEM) at 200 kV and 300 kV with Gatan image filter (GIF) for electron energy loss spectroscopy (EELS). Our automated image analysis software processes >500 individual nanotubes per sample to determine outer diameter, inner diameter, number of walls, and length (via SEM image stitching) with sub‑nanometer precision (±0.05 nm for diameter). For statistical rigor, we provide diameter distribution histograms fitted to log‑normal and Weibull models, and we quantify the wall‑number distribution using high‑angle annular dark‑field (HAADF‑STEM) imaging combined with Fourier filtering to resolve individual graphene layers. Crucially, we also assess tubular straightness and curvature—parameters that strongly affect percolation threshold and rheological properties—through automated curvature analysis algorithms.
Crystallinity, Defect Density, and Surface Chemistry by Raman and X‑Ray Photoelectron Spectroscopy
The Raman spectrum of MWCNTs provides a wealth of information about structural perfection. We use a confocal Raman microscope with multiple excitation wavelengths (532 nm, 633 nm, and 785 nm) to avoid fluorescence artifacts and to probe different penetration depths. We measure the D/G band intensity ratio (ID/IG) and the G’ (2D) band shape, from which we derive crystalline size (La) using the Tuinstra‑Koenig relation, and we further apply multivariate curve resolution (MCR) to deconvolute contributions from amorphous carbon and surface‑bound functional groups. For quantitative defect analysis, we perform temperature‑dependent Raman spectroscopy (77–800 K) to evaluate anharmonicity and defect activation. Complementing this, our X‑ray photoelectron spectroscopy (XPS) with monochromatic Al Kα source and depth profiling (Ar⁺ cluster sputtering) provides surface elemental composition (C, O, and any residual metal), the C=O/C‑O/C‑C ratio from C 1s curve‑fitting, and the graphitic vs. defective carbon percentages. We achieve a precision of ±0.05 for ID/IG and ±1.0 at% for oxygen content.
Thermogravimetric Analysis and Metal Impurity Quantification
Residual metal catalysts (Fe, Co, Ni, Mo) and amorphous carbon are major contaminants that affect both safety and electrical performance. We perform high‑resolution Thermogravimetric Analysis (TGA) under synthetic air (21% O₂/79% N₂) with a controlled heating rate of 1–20 °C/min up to 1000 °C, to determine the oxidation onset temperature (Ton), the temperature of maximum weight loss (Tmax), and the residual mass (ash) corresponding to metal oxides. The derivative thermogravimetric (DTG) curve is deconvoluted to separate amorphous carbon burnout (lower T) from crystalline MWCNT combustion (higher T). The residual ash is then dissolved and analyzed by inductively coupled plasma mass spectrometry (ICP‑MS) to quantify individual metal elements (Fe, Co, Ni, Mo, Al, etc.) with detection limits < 0.5 ppm relative to the original sample. We also offer direct solid‑sampling graphite furnace atomic absorption spectrometry (SS‑GF‑AAS) for ultratrace metal detection without digestion.
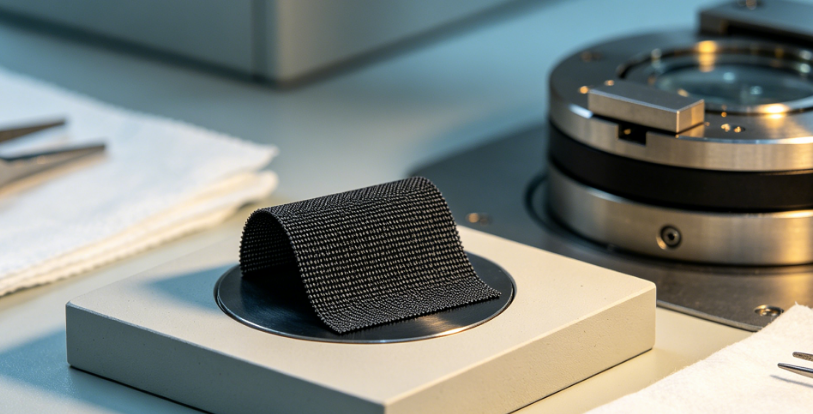
Surface Area, Porosity, and Agglomerate State
The specific surface area and mesoporosity of MWCNTs influence their dispersion behavior and interfacial interaction with matrices. We use nitrogen physisorption at 77 K over a relative pressure range of 10⁻⁶ to 0.995, with BET surface area, t‑plot micropore volume, and BJH mesopore size distribution derived from adsorption and desorption branches. We pay special attention to BET area normalization per gram of carbonaceous content (after correction for metal ash) to avoid overestimation. Additionally, we perform quartz crystal microbalance (QCM) based dispersion stability tests and sedimentation analysis using a centrifugal photosedimentometer to measure agglomerate size distribution in various solvents (water, ethanol, NMP, etc.), providing crucial data for formulation development.
Electrical Conductivity and Purification Efficacy
For applications requiring conductivity, we measure powder resistivity using a four‑point probe under controlled compaction pressure to obtain bulk electrical conductivity (S/cm). We also perform temperature‑dependent resistivity (4–300 K) to characterize the metallic vs. semiconducting character of the tube ensemble. To evaluate purification effectiveness, we combine the above TGA and XPS data with acid digestion followed by ICP‑MS, and we also provide amorphous carbon quantification via UV‑Vis‑NIR spectrophotometry after dispersion in a suitable surfactant, using a calibration curve based on commercial purified MWCNT standards.
Dispersion and Functional Group Density by Zeta Potential and Titration
Surface functional groups (carboxyl, hydroxyl, carbonyl) significantly affect dispersibility and chemical reactivity. We quantify total surface acidity by Boehm titration (automated potentiometric) and specific functional group densities by XPS and FTIR (with ATR). For colloidal stability, we measure zeta potential as a function of pH (2–12) using electrophoretic light scattering (ELS) with automated titration, obtaining the isoelectric point (IEP) and the surface charge density. We further provide dynamic light scattering (DLS) and nanoparticle tracking analysis (NTA) on diluted dispersions to report hydrodynamic size distribution and polydispersity index, which are essential for predicting agglomeration in biological or polymer matrices.
Our Distinctive Competencies and Unmatched Analytical Depth
Our service is uniquely distinguished by the orthogonal and fully cross‑validated integration of HR‑TEM, Raman, XPS, TGA‑ICP‑MS, BET, and dispersion characterization, all performed on the same representative sample split to eliminate heterogeneity artifacts. We operate under ISO/IEC 17025 accreditation with in‑house reference MWCNT materials that have been characterized through interlaboratory comparisons (e.g., NIST RM 8281). Our proprietary data fusion engine combines over 35 independent parameters (including wall number, ID/IG, metal content, and BET area) to generate a “Carbon Nanotube Quality Index” (CNQI) that ranks your material against a database of >200 commercial MWCNT products, enabling benchmarking, supplier qualification, and failure analysis with unprecedented confidence.
We achieve exceptional measurement precision: < 0.5% RSD for outer diameter, < 1.0% for BET surface area, < 1.5% for ID/IG, and < 2.0% for metal impurity at 100 ppm level. Our turnaround time for the full characterization suite is 10–14 working days, with expedited 7‑day service for urgent process control. Crucially, our team of PhD‑level nanomaterial scientists and analytical chemists provides a comprehensive interpretative dossier that connects each structural metric to practical implications—e.g., how higher defect density improves charge storage but reduces electrical conductivity, or how a bimodal diameter distribution may affect mechanical reinforcement. With over 150 successful projects on carbon nanotubes and related nanocarbons, we empower our clients to establish robust internal specifications, optimize synthesis parameters, and ensure regulatory compliance for products ranging from conductive inks to aerospace composites, all backed by the highest level of scientific rigor and technical expertise.