Reasons for choosing our testing services
ZHONGXI Testing has obtained inspection qualification certifications from multiple countries and regions worldwide. We possess a senior testing team and advanced testing methods, providing independent, impartial, and professional third-party verification services for global carbon projects.
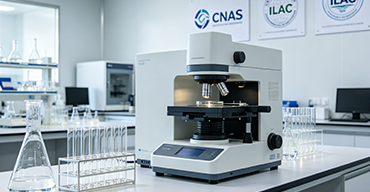
Internationally recognized authority
Certified by multiple international standards such as CNAS, VCS, and GS, with reports universally applicable worldwide.

Global service capability
Covering 140+ countries and regions, it supports on-site detection and remote verification in multiple languages.
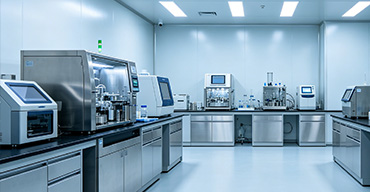
Professional experimental methods
Adopt standard experimental methods to ensure accurate and reliable data.
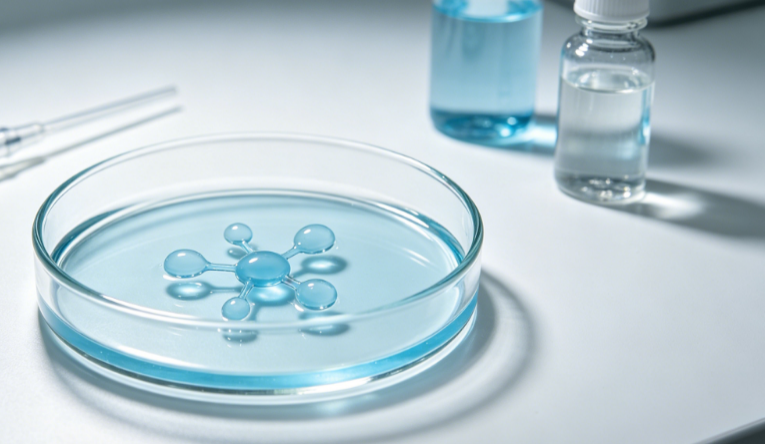
Protein Affinity Testing Services: Accurate Quantification of Biomolecular Interactions
As an independent third-party analytical service provider, we offer comprehensive protein affinity testing for antibodies, receptors, enzymes, therapeutic proteins, and other biomolecules. Affinity – the strength of interaction between two binding partners (e.g., antibody-antigen, receptor-ligand, enzyme-inhibitor) – is a critical parameter in drug discovery, biologics development, quality control, and basic research. Accurate affinity measurement (KD, ka, kd) guides lead optimization, biosimilar comparability, formulation development, and mechanism of action studies. Our accredited laboratory follows international standards (ICH Q6B, USP <1103>, FDA guidance for biologics) using label‑free technologies (surface plasmon resonance – SPR, biolayer interferometry – BLI, microscale thermophoresis – MST, isothermal titration calorimetry – ITC) and other orthogonal methods to deliver precise, reproducible, and regulatorily compliant data. This article outlines our protein affinity testing capabilities – including scope, key test items, and standard methods – to help pharmaceutical companies, biotech firms, and academic researchers characterize biomolecular interactions with confidence.
1. Our Testing Scope for Protein Affinity
We cover a wide range of interaction pairs, sample types, and affinity ranges:
By interaction pair: Antibody‑antigen (mAb to soluble or membrane‑bound target, Fc‑receptor binding, anti‑drug antibody – ADA – to therapeutic protein); Receptor‑ligand (growth factor/receptor, cytokine/receptor, GPCR/agonist, ion channel/ligand); Enzyme‑inhibitor (kinase/inhibitor, protease/inhibitor, ubiquitin ligase/substrate); Protein‑protein (coiled‑coil, PDZ domain/peptide, SH2 domain/phosphopeptide, adaptor protein/signaling partner); Protein‑peptide (linear or cyclic peptides, antimicrobial peptides); Protein‑small molecule (drug candidate to target protein); Protein‑nucleic acid (transcription factor/DNA, RNA‑binding protein/RNA); Bispecific and multispecific molecules (simultaneous binding to two or more targets).
By sample matrix / source: Purified recombinant proteins (human, mouse, rat, cynomolgus, rabbit); Monoclonal antibodies (IgG1, IgG2, IgG4, scFv, Fab, nanobody, bispecific); Cell culture supernatants or lysates (after purification); Native or endogenous proteins (by arrangement); Peptides (synthetic, chemically modified, cyclic); Small molecule compounds (kinase inhibitors, PROTACs, molecular glues); Viral proteins (SARS‑CoV‑2 spike‑RBD, HIV envelope, influenza HA).
By affinity range: High affinity (pM to low nM – typical for antibodies, cytokine‑receptor); Medium affinity (nM to μM – many protein‑peptide, enzyme‑substrate); Low affinity (μM to mM – transient interactions, co‑crystallization screening).
By detection technology / platform: Label‑free technologies: surface plasmon resonance (SPR – Biacore 8K, Biacore T200), biolayer interferometry (BLI – Octet R8, Octet RED96e), microscale thermophoresis (MST – NanoTemper Monolith NT.115), isothermal titration calorimetry (ITC – MicroCal PEAQ‑ITC). Label‑based technologies (by arrangement): fluorescence polarization (FP), ELISA (for relative binding), AlphaLISA, FRET (TR‑FRET).
By industry / application: Therapeutic antibody development – lead candidate ranking, affinity maturation, FcγR/FcRn binding for PK/ADCC/CDC prediction; Biosimilar comparability – demonstrating equivalent binding kinetics to reference product; Small molecule drug discovery – kinase inhibitor profiling, fragment‑based screening, PROTAC ternary complex validation; Vaccine and viral vector development – neutralization antibody binding to spike protein; Basic research – determination of binding thermodynamics, epitope binning, cross‑reactivity assessment.
2. Key Test Items & Measurements We Perform
Our protein affinity testing services deliver quantitative kinetic and thermodynamic parameters, as well as relative binding comparisons.
2.1 Equilibrium Dissociation Constant (KD)
Definition: The concentration of ligand (at equilibrium) that occupies half of the binding sites on the protein. Lower KD indicates higher affinity. Measured in molar units (M, nM, pM).
Measurement methods: Most directly by SPR/BLI (from kinetic ratio Kd/ka). Also by steady‑state analysis in SPR (when kinetics too fast to resolve). By MST and FP, KD is derived from dose‑response curves. By ITC, KD is calculated from titration curve fitting (requires ≈20‑fold excess of one component).
2.2 Kinetic Rate Constants (ka – association rate, kd – dissociation rate)
Definition: ka (M⁻¹s⁻¹) measures how fast the complex forms; kd (s⁻¹) measures how fast it dissociates. KD = kd/ka. These parameters differentiate fast on‑slow off (high affinity antibody) vs. slow on‑slow off, and are critical for predicting residence time and efficacy.
Primary platforms: SPR (Biacore) and BLI (Octet) are gold standards for kinetic measurement. We provide full sensorgram fitting (1:1 binding, two‑state, or heterogeneous analyte models) and report residuals to ensure model quality. For high‑affinity interactions (KD < 100 pM), we use extended dissociation phases (>1 hour) to accurately determine kd (as low as 10⁻⁶ s⁻¹).
2.3 Thermodynamic Parameters (ΔG, ΔH, ΔS, ΔCp)
Definition: ΔG (Gibbs free energy change) = –RT ln (1/KD). ΔH (enthalpy change) and ΔS (entropy change) describe the driving forces of binding (hydrogen bonding, van der Waals, hydrophobic effect). ΔCp (heat capacity change) indicates conformational changes upon binding.
Measurement: ITC is the only method that directly measures ΔH and ΔS from heat released/absorbed during titration. Van‘t Hoff analysis (KD at multiple temperatures) can provide ΔH and ΔS but with lower accuracy. We perform ITC for high‑affinity binders (KD ≤ 10 μM) and for cases where thermodynamic profiling is required (e.g., differentiating binding modes).
2.4 Binding Stoichiometry (n)
Definition: The number of ligand molecules bound per protein molecule (e.g., 1:1, 2:1, 1:2). Deviations from expected stoichiometry may indicate aggregation, misfolding, or oligomeric state differences.
Measurement: ITC directly provides stoichiometry (n) from titration endpoint. SPR (via immobilization level and response units) can also estimate stoichiometry for well‑defined interactions. We report n with a confidence interval.
2.5 Antibody Fc Receptors & FcRn Binding Kinetics
For therapeutic antibodies, binding to Fcγ receptors (FcγRI, FcγRIIa, FcγRIIIa, etc.) and FcRn (neonatal Fc receptor) impacts ADCC, ADCP, and half‑life. We measure these interactions by SPR (Biacore) using recombinant Fcγ receptors and FcRn at pH 6.0 (endosome) and pH 7.4 (surface). Affinity data supports Fc engineering (e.g., afucosylation, Fc mutations).
2.6 Relative Binding (Screening / Comparability)
For high‑throughput screening (e.g., ranking many antibody clones), we offer single‑cycle kinetics (SPR) or gradient concentration binding (BLI). For biosimilar comparability, we perform side‑by‑side binding analysis using the same reference standard, reporting % relative binding and equivalence margins. We also provide epitope binning (competitive binding) to determine whether two antibodies compete for the same binding region.
3. Standard Test Methods We Apply
All assays are performed according to established protocols and, where applicable, ICH/USP/FDA guidelines. Our laboratory is ISO/IEC 17025 accredited for SPR/BLI/ITC and follows GMP principles for biosimilar comparability studies.
3.1 Surface Plasmon Resonance (SPR – Biacore)
Standard protocol (for antibody‑antigen): Ligand (antigen) is immobilized on a CM5 or SA chip (for biotinylated antigen) to a level of 50‑200 RU. Analytic (antibody) is injected at 5‑8 concentrations (e.g., 0.5‑100 nM) over the flow cell, each with 60‑180 s association and 300‑1200 s dissociation (depending on off‑rate). Regeneration with 10 mM glycine pH 2.0 or 3 M MgCl₂. Data are double‑referenced (subtract reference flow cell and buffer blank). Global fitting to 1:1 Langmuir binding model (unless more complex).
High‑affinity extension: For off‑rates slower than 10⁻⁴ s⁻¹, we measure dissociation over 1‑2 hours (or overnight) using a low‑flow rate and extended data collection. This yields accurate kd (down to 10⁻⁶ s⁻¹).
Single‑cycle kinetics (SCK): Inject increasing concentrations without regeneration between cycles, then a single regeneration. Faster throughput, suitable for screening and for antibodies that are sensitive to regeneration conditions.
3.2 Biolayer Interferometry (BLI – Octet)
Standard protocol (for antibody‑antigen): Biotinylated antigen is loaded onto streptavidin (SA) biosensors. Antibody is prepared in 3‑4 concentrations (typically 5‑100 nM) in 96‑well or 384‑well plates. Association (5‑10 min) and dissociation (5‑30 min). Data are reference‑subtracted (blank sensor), and global fitting to 1:1 model.
Advantages: Higher throughput (up to 96 samples simultaneously), no microfluidics, easy to use. Suitable for crude samples (hybridoma supernatants) and high‑throughput screening.
3.3 Microscale Thermophoresis (MST)
Protocol: Label the protein or antibody with a fluorescent dye (e.g., RED‑NHS) or use intrinsic tryptophan fluorescence. Dilute fluorescent tracer to a constant low concentration (2‑10 nM). Prepare a 1:1 dilution series of the unlabeled binding partner (16 steps). Mix equal volumes, incubate at room temperature for 10‑30 minutes, then load into glass capillaries. Measure thermophoresis (temperature jump from 25°C to 35°C) in a Monolith NT.115 instrument. KD derived from dose‑response curve (Hill equation).
3.4 Isothermal Titration Calorimetry (ITC)
Protocol: Protein (20‑100 μM) in the cell, ligand (200‑1000 μM) in the syringe. 19‑25 injections (2‑4 μL each). Reference power 5‑10 μcal/s, stirring 750 rpm. Data integrated and fitted to one‑site binding model (Origin or MicroCal software). Reports KD, ΔH, ΔS, n.
3.5 ELISA (Relative Binding / Titer)
For semi‑quantitative binding (e.g., comparing antigen binding across a 96‑well plate), we use direct or sandwich ELISA. Antigen coated on plate (1‑5 μg/mL); test antibody added in dilution series; detection with HRP‑labeled secondary antibody; colorimetric (TMB) readout. EC₅₀ (half‑maximal effective concentration) is reported. Not for kinetic or absolute KD but useful for screening.
4. Why Choose Our Third‑Party Protein Affinity Testing Services?
As an independent laboratory, we provide unbiased, accurate, and regulatorily compliant data. Our strengths include:
ISO/IEC 17025 accreditation – Our SPR (Biacore), BLI (Octet), MST, and ITC platforms are CNAS/CMA accredited, and our data are accepted by global regulatory agencies for IND and BLA submissions.
Multi‑technology cross‑validation – For critical projects, we cross‑validate affinity results using two orthogonal methods (e.g., SPR + MST, or ITC + BLI) to ensure consistency and rule out assay artifacts.
Low sample consumption – SPR requires as little as 10 μg protein, BLI 2‑5 μg, MST 1‑2 μg, ITC 100‑200 μg.
Wide affinity range – We routinely measure KD from pM (e.g., high‑affinity antibodies) to low mM (weak fragments).
Fast turnaround – Single antibody‑antigen KD (SPR) completed within 1‑2 weeks; panel screening (5‑10 antibodies) within 2‑3 weeks; biosimilar comparability (full kinetics, multiple receptors) within 3‑4 weeks; ITC thermodynamics within 2‑3 weeks.
Detailed reporting – For kinetic experiments: sensorgrams/raw curves, fitted curves with residuals, calculated ka, kd, KD, and R². For ITC: raw thermograms, integrated isotherms, fitted parameters (KD, ΔH, ΔS, n). For MST: fluorescence vs. analyte concentration curves, KD with confidence interval.
Confidentiality – Full protection of antibody sequences, target information, and proprietary compounds.
Consultative support – Our biochemists assist with experimental design (immobilization strategy, buffer selection, regeneration conditions), model selection, and interpretation of complex binding behaviours (e.g., cooperativity, two‑step binding).
Whether you need to rank antibody clones for lead selection, demonstrate biosimilarity of a therapeutic mAb, measure the affinity of a small molecule to its target, or profile Fc‑receptor binding for ADCC prediction, our protein affinity testing experts are ready to deliver precise, actionable data.
Get Started with Your Protein Affinity Testing Project
Contact our team with your protein/antibody information (source, concentration, buffer), binding pair, desired affinity range, and required parameters (KD, kinetics, thermodynamics, relative binding). We will provide a detailed quotation, sample submission guidelines (recommended volume, purity, and buffer conditions), and a testing schedule. Let us help you quantify the strength of your biomolecular interactions with confidence.
This article provides an overview of our protein affinity testing capabilities. For specific assays, sample quantity, and pricing, please request a tailored service proposal.