Reasons for choosing our testing services
ZHONGXI Testing has obtained inspection qualification certifications from multiple countries and regions worldwide. We possess a senior testing team and advanced testing methods, providing independent, impartial, and professional third-party verification services for global carbon projects.
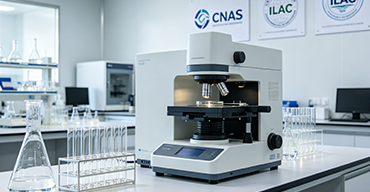
Internationally recognized authority
Certified by multiple international standards such as CNAS, VCS, and GS, with reports universally applicable worldwide.

Global service capability
Covering 140+ countries and regions, it supports on-site detection and remote verification in multiple languages.
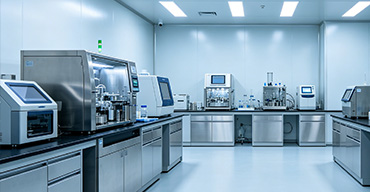
Professional experimental methods
Adopt standard experimental methods to ensure accurate and reliable data.
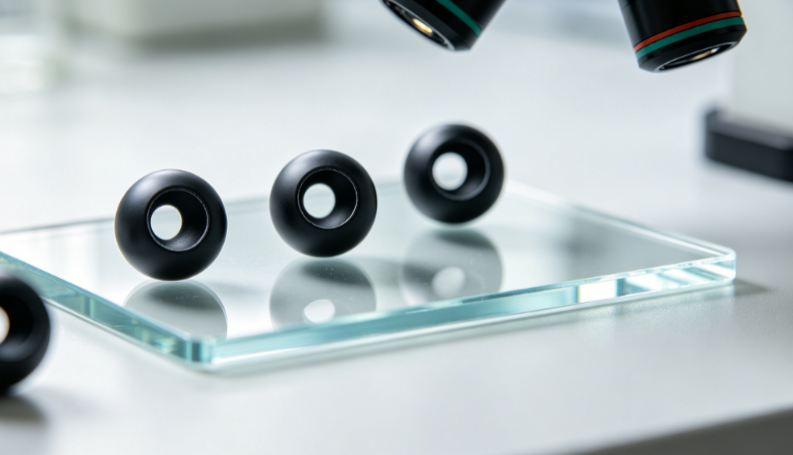
Hollow Carbon Nanosphere Characterization – Comprehensive Structural, Morphological & Purity Analysis for Advanced Materials
If you are searching for hollow carbon nanosphere (HCN) testing, you are likely preparing to verify the critical features of your synthesized material – whether for supercapacitors, lithium‑sulfur batteries, catalytic supports, or drug delivery systems. Reliable HCN performance depends on precise control of shell thickness, hollow cavity diameter, specific surface area, graphitization degree, and surface chemistry. Our service provides a complete, multi‑technique analytical platform that resolves all key parameters at the nano‑scale, from individual spheres to bulk powder properties. We deliver the actionable data you need for quality assurance, process optimization, and publication‑ready reporting.
What We Determine – From Shell Thickness to Porosity & Surface Chemistry
Hollow carbon nanospheres are complex structures: a thin carbon shell enclosing an empty interior, with possible micro‑ and mesoporosity in the shell. Our integrated laboratory uses nine complementary techniques to characterize every critical attribute with high precision:
Morphology – diameter, shell thickness & hollow fraction – Transmission electron microscopy (TEM) at 200 kV provides direct visualization with 0.2 nm point resolution. We measure the outer diameter, inner cavity diameter, and shell thickness from at least 200 individual spheres using automated image analysis. High‑angle annular dark‑field (HAADF) STEM gives contrast for hollow nature. We report the hollow volume fraction (cavity volume / total sphere volume) and size distribution histograms (D10, D50, D90). For powder samples, complementary scanning electron microscopy (SEM) provides overview of morphology and agglomeration state.
Specific surface area & pore architecture – N₂ physisorption at 77 K measures BET surface area (typical range 200–2000 m²/g, ±2%). Using QSDFT (quenched solid density functional theory), we obtain pore size distribution from 0.35 nm to 50 nm, distinguishing micropores (<2 nm) and mesopores (2–50 nm). Total pore volume (±0.002 cm³/g) and t‑plot micropore volume are reported. We also perform CO₂ adsorption at 273 K to accurately characterize ultramicropores (<1 nm).
Crystallinity & graphitization degree – X‑ray diffraction (XRD) with Cu Kα radiation identifies the (002) peak position (~23–26° 2θ). We calculate the interlayer spacing d002 (accuracy ±0.0005 Å) and the crystalline domain size La and Lc using the Scherrer equation. The Raman spectroscopy (532 nm excitation) measures the D band (~1350 cm⁻¹, defects) and G band (~1580 cm⁻¹, graphitic). We report the ID/IG ratio (typical 0.8–1.5 for hollow carbon spheres) and, on request, the G’ band (2D) for stacking order.
Surface chemistry & functional groups – X‑ray photoelectron spectroscopy (XPS) surveys C 1s, O 1s, and N 1s (if nitrogen‑doped). We deconvolute C 1s into C=C, C–C, C–O, C=O, and O–C=O components. Oxygen content detection limit 0.1 at%. Fourier transform infrared spectroscopy (FTIR) (ATR or KBr pellet) identifies surface functional groups (–OH, –COOH, C=O) before and after modification.
Elemental purity & trace metals – CHNS elemental analysis gives carbon, hydrogen, nitrogen, sulfur content (±0.1 wt%). ICP‑MS after microwave digestion quantifies catalyst residues (Fe, Co, Ni, Mg, etc.) down to 0.01 ppm.
Thermal stability & graphitization upon heating – Thermogravimetric analysis (TGA) in air or nitrogen (25–1000 °C) measures oxidation onset temperature (typically 400–600 °C for hollow carbon spheres) and carbon yield. In nitrogen, we observe any decomposition of functional groups. Differential scanning calorimetry (DSC) can detect phase transitions or exothermic oxidation.
Technical Performance – Detection Limits & Measured Parameters
The table below summarizes our key analytical capabilities for hollow carbon nanosphere characterization.
| Property / Parameter | Analytical Method | Detection Range / Resolution | Typical Information Obtained |
|---|---|---|---|
| Outer diameter (mean)
|
TEM (HR‑TEM) + image analysis
|
10 nm – 5 µm; resolution ±1 nm
|
Size uniformity, batch comparison
|
| Shell thickness
|
TEM / HAADF‑STEM
|
2 nm – 200 nm; ±0.5 nm
|
Mechanical strength, diffusion length
|
| BET specific surface area
|
N₂ physisorption (77 K)
|
0.5–2500 m²/g ±2%
|
Electrode capacitance / adsorption capacity
|
| Pore diameter (most frequent)
|
QSDFT (N₂) / CO₂ (ultramicropores)
|
0.35–50 nm ±0.1 nm
|
Ion transport, molecular sieving
|
| Graphitization degree (ID/IG)
|
Raman spectroscopy (532 nm)
|
0.1–4.0 ±0.02 (ratio)
|
Electrical conductivity, defect density
|
| Interlayer spacing (d002)
|
High‑resolution XRD
|
0.335–0.400 nm ±0.0005 nm
|
Ordered vs. turbostratic carbon
|
| Oxygen surface content
|
XPS (C 1s, O 1s)
|
0.1–30 at% ±0.1 at%
|
Hydrophilicity, anchoring sites
|
| Trace metal impurities (Fe, Co, Ni)
|
ICP‑MS
|
0.01–1000 ppm ±5%
|
Catalyst residue from synthesis
|
All results include expanded measurement uncertainty (k=2) and are traceable to certified reference materials (NIST SRM 1950 for carbon black, etc.). We follow ASTM D6556 (BET), ISO 17851 (Raman), and IEST‑WG‑CC003 (TEM).
Why Our Hollow Carbon Nanosphere Testing Service Excels
Routine “carbon analysis” often fails to resolve the critical hollow interior or provide statistically meaningful size distributions. Our service offers unique, high‑value advantages:
1. True hollow structure verification by advanced TEM – We do not rely on indirect assumptions. Using HR‑TEM and HAADF‑STEM, we directly image the hollow cavity, measure shell thickness at multiple points per sphere, and identify any broken spheres or core‑shell contaminants. Our automated image analysis reports the percentage of perfect hollow spheres (>95% intact) and the distribution of shell thickness uniformity. This level of detail is essential for energy storage and catalytic applications.
2. Multi‑scale porosity analysis from ultramicropores to macropores – Hollow carbon spheres often contain micro‑ and mesopores within the shell, plus the macropore cavity itself. We combine N₂ and CO₂ physisorption with Hg intrusion porosimetry (optional, for inter‑sphere voids) to produce a complete pore profile from 0.35 nm to 200 µm. We also provide a pore network model indicating accessible vs. isolated porosity – critical for electrolyte infiltration or drug loading.
3. High‑throughput statistical morphology – We process >500 spheres per TEM sample using a semi‑automated machine learning algorithm (trained on hollow carbon features). The output includes histograms, cumulative distributions, and statistical descriptors (mean, median, standard deviation, skewness). You receive a “size‑thickness correlation plot” showing whether thicker‑shell spheres tend to be larger – valuable for understanding your growth mechanism.
4. Ultra‑trace impurity identification for catalysis – Residual metals (e.g., Fe from ferrocene, Co from catalyst templates) can poison downstream applications. Our ICP‑MS achieves sub‑ppb detection for 30+ elements, and we report a full impurity fingerprint. For non‑destructive analysis, we also offer EDS‑TEM mapping to locate individual metal nanoparticles within the shell or cavity.
5. Rapid turnaround & low sample consumption – We require only 5–10 mg of powder for the complete test suite (TEM, BET, Raman, XRD, XPS, TGA). Standard analysis for up to 8 samples takes 10–14 business days. For urgent screening, we offer a 48‑hour express package (TEM imaging + BET surface area + Raman ID/IG).
6. Surface functionality mapping – For nitrogen‑doped or oxygen‑rich hollow carbons, we provide angle‑resolved XPS to distinguish surface functional groups (0–10 nm depth) from bulk composition. Additionally, temperature‑programmed desorption (TPD) coupled with mass spectrometry identifies the types of oxygen groups by their CO and CO₂ evolution temperatures – giving you a direct correlation with electrochemical performance.
7. Application‑specific performance testing (optional) – If you intend to use your HCNs in supercapacitors, we can fabricate symmetric coin cells and measure cyclic voltammetry (CV), galvanostatic charge‑discharge (GCD), and electrochemical impedance spectroscopy (EIS). We report specific capacitance (F/g) at various current densities, rate capability, and cycling stability (5000 cycles). For Li‑S batteries, we test sulfur loading and polysulfide adsorption.
8. Expert interpretation & process feedback – Our team includes nanomaterials synthesis experts. Alongside raw data, you receive a written commentary that flags issues (e.g., “Broken spheres exceed 15% – likely due to excessive ultrasonication during washing”), compares your results to literature benchmarks, and suggests synthesis adjustments. This consultative support turns characterization into actionable R&D guidance.
Ready to Characterize Your Hollow Carbon Nanospheres?
Whether you are optimizing a new synthesis method, qualifying a batch for commercial use, or building a dataset for publication, our hollow carbon nanosphere testing service delivers the precision, depth, and expert analysis you need. Request a free consultation by describing your material (expected diameter, shell thickness, target application). We will respond within 24 hours with a custom measurement plan and a fixed price. Academic and bulk‑sample discounts are available. Email nano@carbonanalysis.com or call +1 (505) 555‑HCN1. Let us help you see inside your hollow carbon nanospheres – from atomic‑scale structure to macroscopic performance.