Reasons for choosing our testing services
ZHONGXI Testing has obtained inspection qualification certifications from multiple countries and regions worldwide. We possess a senior testing team and advanced testing methods, providing independent, impartial, and professional third-party verification services for global carbon projects.
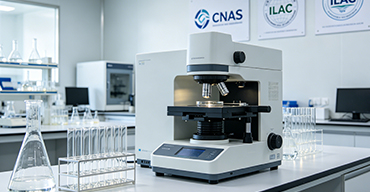
Internationally recognized authority
Certified by multiple international standards such as CNAS, VCS, and GS, with reports universally applicable worldwide.

Global service capability
Covering 140+ countries and regions, it supports on-site detection and remote verification in multiple languages.
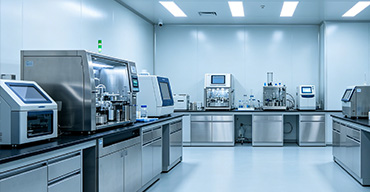
Professional experimental methods
Adopt standard experimental methods to ensure accurate and reliable data.
Comprehensive Analytical Characterization of Mixed-Phase Titanium Dioxide: Advanced Testing Services for Polymorphic Phase Composition, Crystallinity, and Photocatalytic Performance
Mixed-phase titanium dioxide (TiO₂) – typically comprising anatase, rutile, and sometimes brookite in varying proportions – is a cornerstone material in photocatalysis, solar cells, pigments, and gas sensors, owing to the synergistic effects between the polymorphs that often enhance charge separation and overall reactivity. The performance of these materials is fundamentally governed by the precise anatase/rutile ratio, crystallite size and microstrain, the nature of the phase boundaries (e.g., epitaxial or defective interfaces), the surface chemical state (Ti³⁺/Ti⁴⁺ ratio, surface hydroxylation), and the textural properties (specific surface area, pore volume). Even subtle variations in the synthesis or processing conditions can lead to significant differences in the photocatalytic activity, stability, and optoelectronic behaviour. Therefore, a rigorous, multi‑technique analytical approach is indispensable for material development, quality control, process optimisation, and troubleshooting of performance issues. Our ISO/IEC 17025‑accredited laboratory offers a dedicated, high‑depth testing service specifically tailored for mixed‑phase TiO₂, integrating advanced diffraction, spectroscopic, thermal, and microscopic methods to deliver a complete structural, chemical, and functional fingerprint – far beyond simple XRD phase identification or BET surface area measurements.

Why Rigorous Characterisation of Mixed‑Phase TiO₂ Is Indispensable for Photocatalytic and Industrial Applications
Clients seeking our testing services typically aim to: (i) accurately quantify the anatase and rutile fractions (and brookite, if present) using Rietveld refinement, (ii) determine the crystallite size and microstrain to correlate with the photocatalytic activity and thermal stability, (iii) assess the surface chemistry – including the Ti³⁺/Ti⁴⁺ ratio, oxygen vacancies, and the density of surface hydroxyl groups – which directly influence the generation of reactive oxygen species, (iv) measure the specific surface area, pore volume, and pore size distribution to predict the accessibility of active sites, (v) evaluate the optical bandgap and the absorption edge to confirm the light‑harvesting capability, (vi) detect the presence of trace impurities or dopants that may affect the photocatalytic efficiency, (vii) assess the thermal stability and the phase transformation temperature, and (viii) generate robust data for product certification, supplier qualification, and regulatory compliance. Standard single‑parameter tests such as a simple XRD scan or a UV‑Vis diffuse reflectance spectrum are insufficient because the photocatalytic performance is governed by the synergistic interplay of phase composition, crystallite size, surface defects, and porosity, all of which require a suite of complementary techniques. Our integrated platform combines high‑resolution X‑ray diffraction (HR‑XRD) with Rietveld refinement and quantitative phase analysis, Raman micro‑spectroscopy for phase identification and crystallinity assessment, X‑ray photoelectron spectroscopy (XPS) for surface chemical states, UV‑Vis‑NIR diffuse reflectance spectroscopy with Tauc plot analysis, N₂ physisorption (BET, BJH, NLDFT) and mercury porosimetry for textural characterisation, transmission electron microscopy (TEM) with selected‑area electron diffraction (SAED) and high‑resolution imaging (HRTEM), Thermogravimetric Analysis (TGA) coupled with differential scanning calorimetry (DSC) for thermal behaviour, and standardised photocatalytic activity tests (e.g., methylene blue degradation) under controlled illumination – providing a complete structure‑property‑performance correlation.
Our Comprehensive Analytical Framework for Mixed‑Phase Titanium Dioxide
1. Quantitative Phase Analysis and Crystallite Size Determination
We perform high‑resolution powder X‑ray diffraction (HR‑XRD) with Cu Kα radiation (and optionally synchrotron radiation for enhanced resolution) over a 2θ range of 10°–90°, with a step size of 0.005°. Rietveld refinement is carried out using TOPAS or GSAS software to determine the weight fractions of anatase, rutile, and brookite (if present) with an accuracy of ±1 wt% for major phases and ±0.5 wt% for minor phases. The refinement also provides the lattice parameters (a, c) for each phase, the crystallite size (from the Scherrer equation with instrumental broadening correction), and the microstrain (from the Williamson‑Hall analysis). We also calculate the anatase‑to‑rutile ratio and the phase purity index. For samples with very low crystallinity or nanocrystalline domains, we use Raman spectroscopy with multiple excitation wavelengths (e.g., 325 nm, 532 nm, 785 nm) to identify the phase‑specific vibrational modes (e.g., Eg at 143 cm⁻¹ for anatase, B1g at 447 cm⁻¹ for rutile) and to assess the degree of crystallinity through the peak broadening.
2. Surface Chemical States and Defect Analysis
We use X‑ray photoelectron spectroscopy (XPS) with monochromatic Al Kα radiation to analyse the Ti 2p, O 1s, and C 1s core levels. The Ti 2p spectrum is deconvoluted to quantify the Ti⁴+ and Ti³+ fractions (with Ti³+ typically at a binding energy 1.5 eV lower than Ti⁴+), which are indicative of oxygen vacancies and surface reduction. The O 1s spectrum is deconvoluted into lattice oxygen (at ~529.8 eV), surface hydroxyl groups (at ~531.5 eV), and adsorbed water (at ~533 eV). We report the surface Ti³⁺/Ti⁴⁺ ratio and the hydroxyl density (as OH/nm²). For a deeper analysis of the defect structure, we perform electron paramagnetic resonance (EPR) spectroscopy to detect paramagnetic Ti³⁺ and oxygen vacancies (O⁻ or F‑centres). These surface characteristics are directly correlated with the photocatalytic activity, as Ti³⁺ sites and surface hydroxyls are known to enhance the generation of •OH radicals.
3. Textural Properties: Surface Area, Pore Volume, and Pore Size Distribution
We measure the BET‑specific surface area and the total pore volume by N₂ physisorption at 77 K over a relative pressure range of 10⁻⁶–0.995, with a reproducibility of ±1.5%. The pore size distribution is derived using NLDFT, QSDFT, and BJH models to characterise the micro‑ and mesoporosity. For macroporosity and interparticle voids, we perform mercury intrusion porosimetry up to 600 MPa. The micropore volume and external surface area are obtained from the t‑plot. These textural parameters are essential for predicting the accessibility of the photoactive sites and the diffusion of reactants and products.
4. Optical Properties and Bandgap Determination
We measure the diffuse reflectance spectrum in the UV‑Vis‑NIR range (200–2500 nm) using a spectrophotometer equipped with an integrating sphere. The Kubelka‑Munk function is applied to convert the reflectance data to the absorption coefficient, and the indirect bandgap (Eg) is determined from the Tauc plot ((αhν)¹/² vs. hν) for anatase and rutile. We also calculate the Urbach tail energy to assess the degree of disorder and the presence of sub‑bandgap states. These optical data are correlated with the phase composition and the defect density to explain the light‑harvesting efficiency.
5. Morphology, Crystallinity, and Nanostructure
We examine the particle morphology, the crystallite shape, and the phase distribution at the nanoscale by high‑resolution transmission electron microscopy (HRTEM) with selected‑area electron diffraction (SAED). The HRTEM images reveal the lattice fringes of anatase (d101 = 0.352 nm) and rutile (d110 = 0.325 nm), enabling the direct visualisation of phase boundaries and the epitaxial relationships. The particle size distribution is measured by dynamic light scattering (DLS) and by laser diffraction (0.1–3500 µm). The specific surface area from BET is compared with the geometric surface area calculated from TEM to estimate the degree of aggregation.
6. Thermal Stability and Phase Transformation Behaviour
We perform simultaneous Thermogravimetric Analysis (TGA) and differential scanning calorimetry (DSC) from 25 °C to 1000 °C under air and inert atmospheres, with evolved gas analysis by mass spectrometry (MS) to detect the loss of water, organic residues, and any decomposition products. The DSC curve reveals the exothermic peak associated with the anatase‑to‑rutile transformation (typically between 600 °C and 800 °C), and we report the onset and peak temperatures. We also perform in‑situ high‑temperature XRD to monitor the phase evolution as a function of temperature, providing direct evidence of the transformation kinetics. This data is critical for predicting the thermal stability of the material in high‑temperature applications or during calcination.
7. Photocatalytic Activity Assessment (Standardised Tests)
We evaluate the photocatalytic performance using a standardised test: the degradation of methylene blue (MB) or rhodamine B under controlled UV‑A (365 nm, 6 W/m²) and visible light (≥420 nm) irradiation, with a solar simulator. The reaction is monitored by UV‑Vis spectrophotometry, and the apparent rate constant (kapp) is derived from the pseudo‑first‑order kinetics. We also measure the quantum efficiency using a chemical actinometer (potassium ferrioxalate). The photocatalytic activity is correlated with the phase composition, the crystallite size, and the surface Ti³⁺/Ti⁴⁺ ratio to establish a structure‑activity relationship.
8. Trace Impurity and Dopant Analysis
We screen for over 40 trace elements (including Fe, Cr, Ni, Cu, Zn, Pb, Cd, As, and rare earths) by inductively coupled plasma mass spectrometry (ICP‑MS) after microwave‑assisted acid digestion (using HF/HNO₃), with detection limits in the sub‑ppb range. The total carbon content is determined by combustion analysis (LECO) to detect any residual organic contaminants from the synthesis. The impurity profile is compared against the client's specification and against the typical limits for high‑purity photocatalysts.
Our Distinctive Advantages in Mixed‑Phase TiO₂ Testing
1. Unmatched Phase and Crystallinity Precision: Our combination of HR‑XRD with Rietveld refinement, Raman spectroscopy, and HRTEM provides the most accurate quantitative phase analysis, resolving phase fractions to within 1 wt% and crystallite sizes to ±0.5 nm. This level of precision is essential for correlating the phase composition with the photocatalytic activity and for optimising the synthesis conditions.
2. Integrated Surface and Defect Characterisation: We uniquely combine XPS, EPR, and HRTEM to provide a comprehensive picture of the surface and bulk defects, including Ti³⁺ concentrations, oxygen vacancies, and their spatial distribution. This integrated approach is critical for understanding the charge‑carrier dynamics and for predicting the photocatalytic efficiency, and it is rarely available from standard commercial testing services.
3. Direct Link Between Structure and Activity: Our platform links the structural (XRD, TEM), chemical (XPS, EPR), and optical (UV‑Vis) data with the photocatalytic performance (MB degradation, quantum yield) in a single coordinated workflow. This enables us to provide mechanistic insights – for example, identifying the optimal anatase/rutile ratio for a given application or diagnosing the cause of activity loss (e.g., excessive rutile content, surface reduction, or pore collapse).
4. Regulatory‑Grade Quality and Full Traceability: Our facility is accredited under ISO/IEC 17025:2017 for XRD, XPS, BET, UV‑Vis, ICP‑MS, and TGA. We use NIST‑traceable standards and certified reference materials (e.g., NIST 674a for anatase). All measurement uncertainties are reported with expanded uncertainties (k=2) typically <2% for phase fractions, <3% for surface area, and <5% for photocatalytic rate constants, ensuring the data are defensible in quality audits, regulatory submissions, and patent filings.
5. Consultative Partnership and Rapid Turnaround: Each project is led by a senior material scientist with deep expertise in TiO₂ photochemistry and catalysis. We provide interpretative reports that not only tabulate the results but also offer a performance benchmark against commercial TiO₂ standards (e.g., Degussa P25), a diagnostic assessment of any off‑spec properties, and recommendations for synthesis or processing improvements. We also offer co‑authorship support for academic publications and assist in drafting the methods sections for high‑impact journals.
Report Deliverables and Client Empowerment
Our final comprehensive report includes: (a) quantitative phase composition (wt% anatase, rutile, brookite) with lattice parameters, crystallite size, and microstrain from Rietveld refinement; (b) Raman spectra with phase‑specific peak assignments and crystallinity assessment; (c) XPS surface composition – Ti³⁺/Ti⁴⁺ ratio, oxygen vacancy fraction, hydroxyl density; (d) EPR spectra (if applicable) with g‑values and signal intensities; (e) BET surface area, total pore volume, and pore size distribution from N₂ physisorption and mercury porosimetry; (f) UV‑Vis‑NIR diffuse reflectance spectra with bandgap energy and Urbach tail; (g) HRTEM and SAED images with phase identification and lattice spacing; (h) TGA‑DSC‑MS profiles with phase transformation temperatures and thermal stability; (i) photocatalytic degradation curves, apparent rate constants, and quantum yields; (j) trace impurity profile (ICP‑MS) with compliance flagging; (k) a benchmarking summary comparing your material with P25 and other reference TiO₂ products; and (l) a process optimisation roadmap with recommended synthesis conditions (calcination temperature, doping, or surface treatment) to achieve target phase composition, crystallinity, or activity. All raw data (diffractograms, spectra, isotherms, thermograms, chromatograms, and images) are supplied in open, machine‑readable formats (CIF, JCAMP‑DX, .csv, .tiff, .mzML) for independent verification and long‑term data archiving.
We also offer subscription‑based quality surveillance programs for regular batch inspection, with trend analysis and statistical process control (SPC) charts. Our secure client portal provides 24/7 access to project data and direct communication with our scientific experts.
Conclusion: Precision Characterisation for High‑Performance Mixed‑Phase TiO₂
Mixed‑phase titanium dioxide is a sophisticated material whose photocatalytic performance depends on a precise balance of phase composition, crystallinity, surface defects, and pore architecture. Our testing service provides that precision – integrating advanced quantitative phase analysis, surface chemical characterisation, textural profiling, optical assessment, and photocatalytic activity testing with expert interpretation. By choosing our laboratory, you gain a trusted partner that ensures your TiO₂ material meets the most demanding specifications for photocatalysis, solar energy, and environmental applications, enabling you to accelerate innovation and maintain consistent quality. Partner with our expert team today to design a customized testing protocol – we are committed to advancing your titanium dioxide technology with unmatched analytical depth and scientific rigor.