Reasons for choosing our testing services
ZHONGXI Testing has obtained inspection qualification certifications from multiple countries and regions worldwide. We possess a senior testing team and advanced testing methods, providing independent, impartial, and professional third-party verification services for global carbon projects.
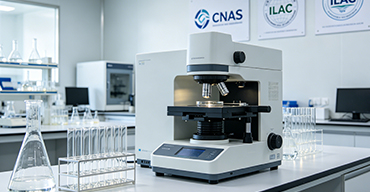
Internationally recognized authority
Certified by multiple international standards such as CNAS, VCS, and GS, with reports universally applicable worldwide.

Global service capability
Covering 140+ countries and regions, it supports on-site detection and remote verification in multiple languages.

Professional experimental methods
Adopt standard experimental methods to ensure accurate and reliable data.
Comprehensive Substrate Characterization for LED Epitaxy – Advanced Materials Analysis Services
The substrate upon which a light-emitting diode (LED) heterostructure is grown is far more than a passive mechanical support; it is a critical determinant of epitaxial quality, device efficiency, and long-term reliability. For III-nitride-based LEDs (blue, green, and UV), the primary substrates – sapphire (Al₂O₃), silicon carbide (SiC), silicon (Si), and gallium nitride (GaN) – each impose specific lattice mismatch, thermal expansion coefficient, and surface chemistry constraints that profoundly influence threading dislocation density, residual stress, and wafer bowing. As LED manufacturers push toward higher power densities, smaller chip sizes, and novel architectures such as micro-LEDs and vertical-cavity surface-emitting lasers (VCSELs), the rigorous quality assessment of incoming substrates has become an indispensable prerequisite for achieving acceptable epitaxial yields and device performance. Clients seeking substrate testing services typically aim to: (i) qualify new substrate suppliers and monitor batch-to-batch consistency, (ii) detect subsurface damage or surface contamination that can propagate into epitaxial defects, (iii) quantify wafer curvature and stress to predict and mitigate bowing-induced pattern distortion in photolithography, (iv) characterize electrical properties for conductive substrates (e.g., SiC, Si) that affect vertical current injection, and (v) generate comprehensive material certificates for process integration and customer assurance. To meet these stringent demands, our laboratory offers a fully integrated, ISO-accredited substrate testing service that combines non-destructive metrology, structural analysis, and advanced surface diagnostics, delivering a multidimensional quality fingerprint that empowers LED fabs to optimize growth conditions and maximize device performance.
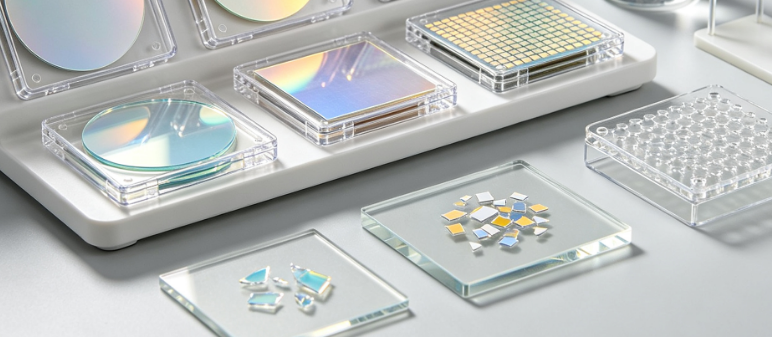
Multi-Modal Surface and Sub-Surface Integrity Assessment
The surface condition of an LED substrate directly dictates the nucleation and coalescence of the buffer layer, influencing the entire epitaxial stack. Our primary surface metrology platform employs a combination of atomic force microscopy (AFM), white-light interferometry (WLI), and Nomarski differential interference contrast (DIC) microscopy to evaluate roughness parameters (Ra, Rq, Rz) over scan areas ranging from 1 μm × 1 μm to 1 mm × 1 mm. We measure step height, pit density, and scratch morphology with sub-nanometer vertical resolution, and we automatically classify surface defects according to size, shape, and distribution using machine-learning algorithms integrated into our image analysis pipeline. For sapphire substrates, we specifically assess the orientation-dependent miscut angle (typically 0.2°–0.5° towards the m-plane or a-plane), which is critical for step-flow growth and the formation of smooth surface morphology. Our goniometric XRD system (high-resolution Panalytical X'Pert MRD) provides miscut angles with an accuracy of ±0.01°, enabling precise alignment for the epitaxial reactor.
Beyond surface topography, we address the subsurface damage layer induced by wafer sawing, grinding, and chemical-mechanical polishing (CMP). Using a combination of confocal Raman spectroscopy (with depth-profiling capability) and cross-sectional transmission electron microscopy (TEM) on specially prepared lift-out samples, we quantify the thickness and crystalline quality of the amorphous or highly defective layer that often remains even after CMP. This damage layer, typically 10–50 nm thick for sapphire, can act as a source of point defects and impurity gettering, degrading the subsequent AlN nucleation layer quality. Our Raman depth profiles, acquired with a 532 nm laser and step sizes of 2 nm, measure the frequency and width of substrate-specific phonon modes (e.g., the 417 cm⁻¹ and 750 cm⁻¹ modes for sapphire) to map stress gradients and structural order as a function of depth, providing a non-destructive alternative to TEM for routine screening.
Crystallographic Perfection and Lattice Mismatch Quantification
High-resolution X-ray diffraction (HR-XRD) is the cornerstone of our substrate crystallinity evaluation. Using a four-crystal monochromator and a triple-axis analyzer, we perform rocking curve (ω-scan) measurements on the dominant substrate reflections (e.g., (0006) for sapphire, (0004) for SiC, (004) for Si, and (0002) for free-standing GaN). The full width at half maximum (FWHM) of these rocking curves serves as a direct indicator of mosaic spread and dislocation density, with state-of-the-art substrates achieving FWHM values below 30 arcsec for sapphire and below 50 arcsec for SiC. We also perform reciprocal space mapping (RSM) around asymmetric reflections (e.g., (10–12) for sapphire) to evaluate lattice tilt, twist, and their anisotropy, which are critical for understanding the in-plane strain distribution that affects the quantum well emission uniformity. For pseudomorphic growth, the lattice mismatch between substrate and the subsequent GaN buffer layer is calculated with an accuracy of ±1×10⁻⁵, enabling clients to fine-tune the AlN nucleation conditions (thickness, V/III ratio, and growth temperature) for optimal stress engineering.
For silicon substrates (used increasingly for large-diameter, low-cost LEDs), we offer comprehensive bow and warp characterization using a non-contact laser triangulation system that maps the wafer surface topography at over 10,000 points per wafer. We derive global bow (GB), total thickness variation (TTV), and site flatness (SFQR) parameters, all critical for photolithographic resolution and die-to-die uniformity. The residual stress in silicon substrates, arising from the high-temperature AlN or GaN growth, is quantified by measuring the wafer curvature change before and after a simulated thermal budget (using a rapid thermal annealer) and applying Stoney's equation. Our system provides stress maps with a spatial resolution of 5 mm, allowing identification of local stress hotspots that may lead to crack formation or delamination.
Chemical Purity and Contamination Analysis
Impurities in the substrate bulk or at the surface can diffuse into the epitaxial layers, acting as non-radiative recombination centers or dopant compensators. Our chemical analysis suite includes glow discharge mass spectrometry (GDMS) for bulk trace-element quantification, covering over 70 elements with detection limits down to 0.01 ppb for critical contaminants such as Fe, Cr, Ni, and Cu. For surface contamination, we employ total reflection X-ray fluorescence (TXRF) with a detection sensitivity of <1×10¹⁰ atoms/cm² for transition metals, and time-of-flight secondary ion mass spectrometry (ToF-SIMS) for organic residues, fluorine, and sodium. We perform depth-resolved SIMS profiling to detect impurity segregation at the near-surface region (0–100 nm), which is particularly relevant for substrates that have undergone chemical cleaning or etching processes. All contamination results are compared against industry-accepted specification limits (e.g., SEMI M60, M67 for sapphire and SiC), and we provide a comprehensive contamination risk assessment that includes recommendations for cleaning recipe adjustment or handling procedure improvement.
Additionally, we use infrared spectroscopy (FTIR) to identify and quantify oxygen and carbon incorporation in silicon substrates (interstitial O and substitutional C), as these impurities affect thermal donors and minority carrier lifetime – parameters that become increasingly important for GaN-on-Si power and RF applications. For SiC substrates, we measure the nitrogen doping concentration (for n-type substrates) and aluminum concentration (for p-type) using a combination of FTIR and room-temperature Hall effect, ensuring that the substrate's electrical properties are within the specified range for vertical current conduction.
Thermal and Mechanical Property Assessment
The thermal expansion mismatch between substrate and GaN epitaxial layers is a major source of stress and wafer bowing, especially during cooling from growth temperatures (~1000 °C). We measure the coefficient of thermal expansion (CTE) of the substrate material using a push-rod dilatometer over the range of 25 °C to 1100 °C, with an accuracy of ±0.02 ppm/K. This data, combined with our HR-XRD stress measurements, enables clients to model the final bow and to design graded buffer layers or stress-compensation schemes. For substrates that undergo high-temperature processing, we also evaluate thermal stability by subjecting them to multiple rapid thermal cycles (up to 10 cycles, 1200 °C, 10 s) and re-measuring the crystallinity and surface roughness to detect any thermal degradation, such as surface step bunching or the formation of thermal etch pits.
Mechanical robustness is assessed via a four-point bending test on a universal testing machine (Instron 5960) to determine the flexural strength and Weibull modulus of the substrate material. We also measure hardness and fracture toughness using a nanoindenter (Berkovich tip) with depths up to 2 μm, providing data that is essential for backend processing steps such as wafer dicing, thinning, and chip separation. These mechanical parameters are particularly critical for large-diameter (>150 mm) wafers where handling and processing-induced breakage can significantly affect yield.
Thickness, Flatness, and Optical Homogeneity
Precise substrate thickness and flatness are essential for consistent temperature distribution and gas flow dynamics in the MOCVD reactor. Our non-contact capacitive and optical interferometric gauges measure thickness with a precision of ±0.1 μm and provide full-wafer maps of total thickness variation (TTV), warp, and sag. For transparent substrates such as sapphire and SiC, we use infrared transmission interferometry (10.6 μm wavelength) to obtain thickness data without background reflection interference. For silicon substrates, we use infrared absorption-based measurement at 1.55 μm. All data are expressed as bow, warp, and TTV as per SEMI M1, M53, and M67 standards, enabling direct comparison with supplier specifications.
Optical homogeneity – including refractive index uniformity and birefringence – is assessed using a phase-shifting interferometer (Zygo Verifire) operating at 632.8 nm, which provides a transmission wavefront map with a resolution of better than λ/20. This is particularly important for substrates intended for micro-LED projection and AR/VR applications, where phase distortions can degrade optical efficiency and image quality. We also perform spectrophotometric transmission and reflection measurements (190–2500 nm) to verify the substrate's cut-off wavelength and internal transmittance, ensuring that it does not absorb in the emission range of the LED structure (typically 400–700 nm for visible, or below 280 nm for UV).
Advanced Defect Microscopy and Classification
In addition to surface roughness, we employ a series of defect-selective etching techniques combined with optical microscopy to reveal and classify crystallographic defects such as dislocations, stacking faults, and micropipes (especially in SiC). For sapphire, phosphoric acid (H₃PO₄) etching at 300 °C preferentially attacks dislocation sites, allowing us to calculate etch pit density (EPD) with values typically ranging from <100 cm⁻² (for high-quality Kyropoulos sapphire) to >500 cm⁻². We use automated optical microscopes with image processing to count pits over the entire wafer surface, providing EPD maps that reveal spatial inhomogeneities. For SiC substrates, we use molten KOH etching followed by similar counting, with a focus on micropipe density (which must be <1 cm⁻² for power electronics applications, but even lower for LED applications to avoid leakage paths).
Furthermore, we offer photoluminescence (PL) mapping at room temperature and 4 K using a 325 nm HeCd laser, which allows detection of intrinsic and impurity-related luminescence bands that can indicate the presence of deep-level defects or stress variations. For silicon substrates, we provide minority carrier lifetime mapping via microwave-detected photoconductance (MDP) to assess the recombination activity of metallic contaminants – a parameter that indirectly correlates with the quality of the buffer layer grown on top. All defect and lifetime maps are generated with 1 mm spatial resolution, and we provide statistical summaries (mean, standard deviation, and percentiles) that are directly usable for supplier qualification and process control.
Our Distinctive Competencies and Added Value
What sets our substrate testing service apart is the holistic, correlated approach that integrates structural, chemical, thermal, and optical data into a unified material quality report. We do not simply deliver a collection of separate test results; we provide a comprehensive interpretive summary that highlights potential risks for epitaxial growth, such as a combination of high EPD and high surface roughness indicating poor polishing, or a mismatch between CTE and expected growth temperature that may lead to excessive bow. Our scientific team comprises specialists in crystal growth and epitaxy, enabling us to offer actionable advice, such as suggesting pre-growth annealing conditions, nucleation layer thickness adjustments, or co-doping strategies to mitigate substrate-induced defects.
Our infrastructure includes ISO 5 (Class 100) cleanroom facilities for sample handling, ensuring that no adventitious contamination is introduced during characterization. We maintain a fleet of state-of-the-art instruments, including a JEOL JEM-2100F TEM, a Bruker Dimension Icon AFM, a PANalytical MRD XL HR-XRD, and a Thermo Fisher Scientific iCAP TQ ICP-MS for trace metal analysis, all calibrated with NIST-traceable standards. Our laboratory is accredited to ISO/IEC 17025 for substrate test methods, and we actively participate in round-robin tests organized by SEMI and ASTM to ensure inter-laboratory consistency. We offer rapid turnaround – typically 3–5 business days for a full characterisation package – and we provide secure electronic data transfer with options for custom reporting formats (Excel, XML, or JMP) to facilitate integration with your statistical quality control systems.
We also offer bespoke test protocols for emerging substrate materials, such as AlN templates, Ga₂O₃, and diamond-like carbon coated substrates. Our flexibility extends to on-site testing services for clients who require real-time wafer mapping during production, using portable metrology tools (e.g., portable Raman or reflectometer) with the same rigor as our in-house instruments. In addition, we provide consultancy on substrate selection, comparing multiple suppliers and grades to help you achieve the optimal balance between cost and performance for your specific LED wavelength and chip design.
Comprehensive Service Modules – Tailored to Your Production and R&D Needs
We offer a modular service portfolio that allows clients to select the tests most relevant to their specific substrate type and application:
Module 1 – Surface Quality and Roughness Assessment: AFM, WLI, and DIC microscopy for Ra/Rq/Rz over multiple scan sizes, with defect classification and pit density count – essential for incoming quality control.
Module 2 – Crystallinity and Mismatch Characterization: HR-XRD rocking curves (FWHM), reciprocal space mapping, miscut angle measurement, and lattice parameter determination – critical for epitaxial yield prediction.
Module 3 – Wafer Geometry and Flatness: Bow, warp, TTV, and site flatness using laser interferometry, with full-wafer contour maps – important for photolithography and MOCVD loading uniformity.
Module 4 – Bulk and Surface Contamination Screening: TXRF, ToF-SIMS, GDMS, and ICP-MS for trace elements and organic residues, with comprehensive reporting against SEMI and customer-specific limits.
Module 5 – Thermal and Mechanical Properties: CTE (RT–1100 °C), four-point bending strength, nanoindentation hardness, and thermal cycling stability – key for stress simulation and handling reliability.
Module 6 – Optical and Defect Mapping: Transmission/reflection spectrophotometry, wavefront interferometry, EPD mapping after wet etching, PL and lifetime mapping – providing holistic material quality fingerprints.
Module 7 – Correlated Data Analysis and Consulting: Integration of all module results into a single report with expert interpretation, root-cause analysis of anomalies, and recommendations for substrate selection or growth optimization.
We accept all standard substrate diameters (2″, 4″, 6″, and 8″) and thicknesses, as well as small research samples. Our minimum sample requirement is 1 full wafer per test, but we also offer multi-site sampling for larger batches. We provide volume-discounted pricing for long-term contracts and continuous monitoring programs.
Data Integrity, Traceability, and Compliance
All measurements are performed under rigorous environmental control (temperature 20.0 ± 0.5 °C, humidity 45 ± 5%) to minimize measurement uncertainty. We maintain full traceability to international standards for each instrument, with calibration intervals defined by national and international accreditation bodies. Our data management system (LIMS) records every step of the measurement process, including operator identification, instrument settings, and calibration status, ensuring full auditability. We also offer GLP-compliant documentation for clients in regulated industries (e.g., medical UV LEDs, aerospace), with study plans, raw data archives, and signed certificates of analysis. Our commitment to data security is paramount; we store all client data on encrypted servers with restricted access and can provide a tailored confidentiality agreement upon request.
Client Engagement and Project Workflow
Engaging our substrate testing service is straightforward. It begins with a consultative call to define your substrate type, critical parameters, and desired standards. We then prepare a detailed quote, including sample handling guidelines (e.g., packaging for ESD-sensitive wafers, orientation marking). Upon receipt, samples are logged, inspected for visible damage, and preconditioned if required (e.g., annealing for stress relaxation). Testing proceeds in parallel where possible, with real-time updates and preliminary data provided via our client portal. The final report is delivered in PDF, with editable data tables upon request. A complimentary debrief session is included to discuss the results, answer questions, and propose follow-up actions – such as adjusting CMP parameters or choosing a different substrate grade. Our expert team is available for ongoing consultation throughout your product development lifecycle.
Conclusion – Advancing LED Manufacturing with Substrate Excellence
The foundation of any high-performance LED is its substrate, and the meticulous characterization of that substrate is a non-negotiable step towards achieving optimal epitaxial quality, device efficiency, and long-term reliability. Our integrated, ISO-accredited substrate testing service delivers unrivalled analytical depth, correlated insights, and actionable recommendations that go far beyond simple compliance. With our advanced instrumentation, experienced scientific team, and commitment to client partnership, we empower LED manufacturers to confidently select, qualify, and process substrates, thereby reducing yield losses, accelerating time-to-market, and enhancing product competitiveness. Whether you are working with sapphire for high-brightness white LEDs, silicon for low-cost micro-LEDs, or SiC for power-related optoelectronics, our testing solutions are tailored to meet your specific challenges and objectives.
We invite you to contact our substrate characterization specialists to discuss your current and future testing needs. Let us help you build a solid foundation for your next-generation LED innovations – from precise crystal orientation to pristine surface cleanliness, from stress-free flatness to ultrapure bulk material. Your journey to superior LED performance begins with the substrate, and our comprehensive testing ensures that journey starts on the strongest possible footing.