Reasons for choosing our testing services
ZHONGXI Testing has obtained inspection qualification certifications from multiple countries and regions worldwide. We possess a senior testing team and advanced testing methods, providing independent, impartial, and professional third-party verification services for global carbon projects.

Internationally recognized authority
Certified by multiple international standards such as CNAS, VCS, and GS, with reports universally applicable worldwide.

Global service capability
Covering 140+ countries and regions, it supports on-site detection and remote verification in multiple languages.

Professional experimental methods
Adopt standard experimental methods to ensure accurate and reliable data.
Advanced Characterization and Reliability Assessment for GaN Nanowire Devices – Comprehensive Analytical Services
Gallium nitride (GaN) nanowires have emerged as a transformative platform for next‑generation optoelectronics, high‑power electronics, and quantum photonics, offering unique advantages arising from their high surface‑to‑volume ratio, strain‑relaxed growth, and defect‑reduced active regions. Unlike planar heteroepitaxial films, GaN nanowires enable monolithic integration on diverse substrates (Si, sapphire, SiC, graphene) with dramatically lower threading dislocation densities, making them ideal for UV‑to‑visible LEDs, laser diodes, high‑electron‑mobility transistors (HEMTs), and single‑photon sources. However, the dimensional, structural, and compositional heterogeneity inherent in nanowire ensembles – together with their sensitivity to surface states, sidewall roughness, and non‑uniform doping – imposes stringent requirements on their multimodal characterization. Clients seeking GaN nanowire testing services typically aim to: (i) quantify the morphology and diameter distribution critical for quantum confinement and optical mode confinement, (ii) assess crystalline quality, phase purity, and strain state at the single‑nanowire and ensemble levels, (iii) determine axial and radial composition profiles, including dopant incorporation and alloy fluctuations (e.g., InGaN, AlGaN), (iv) evaluate surface chemistry and passivation effectiveness, (v) measure electrical transport (conductivity, mobility, carrier concentration) and photoresponse, (vi) assess electroluminescence and photoluminescence efficiency and stability, and (vii) perform accelerated stress tests to predict device lifetime under operational conditions. Our laboratory offers a fully integrated, ISO/IEC 17025‑accredited GaN nanowire testing service that combines single‑nanowire metrology, ensemble statistical analysis, and correlative microscopy‑spectroscopy to deliver a holistic performance fingerprint. We go beyond routine reporting by providing quantitative structure‑property correlations and physics‑based degradation models, empowering clients to optimize growth conditions, device design, and packaging with unmatched confidence.
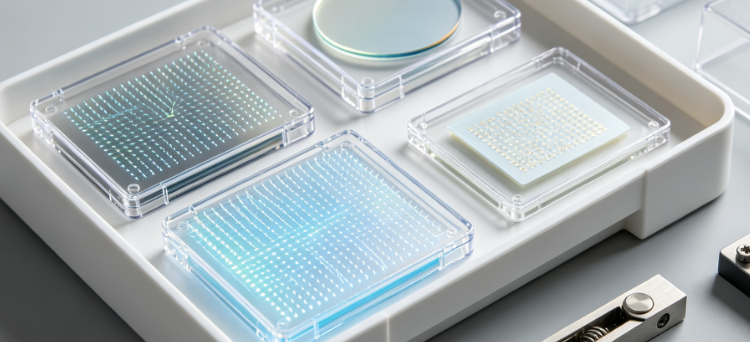
Morphological and Dimensional Analysis – From Ensembles to Single Nanowires
Accurate measurement of nanowire diameter, length, aspect ratio, and density is fundamental for bandgap engineering, light extraction efficiency, and carrier dynamics. Our primary platform is a field‑emission scanning electron microscope (FE‑SEM) (Zeiss Gemini 500) with automated image analysis software that performs statistically robust measurements on thousands of nanowires per sample, providing diameter distribution histograms, length uniformity, and areal density maps over areas up to 1 mm². For sub‑10 nm features, we employ transmission electron microscopy (TEM) (JEOL JEM‑2100F) with high‑angle annular dark‑field (HAADF) imaging, achieving atomic‑scale resolution of sidewall roughness, faceting, and tapering. We complement this with atomic force microscopy (AFM) in tapping and peak‑force modes to measure the three‑dimensional morphology, including top‑surface roughness, growth direction alignment, and substrate interface morphology. Our automated defect classification algorithm (based on convolutional neural networks) distinguishes between isolated nanowires, bundles, and parasitic nucleation sites, delivering quality scores that correlate with subsequent device performance.
For vertical nanowires grown on opaque substrates, we utilize cross‑sectional SEM and focused ion beam (FIB) tomography to reconstruct the 3D shape, revealing basal diameter, tip radius, and sidewall angle. We also apply small‑angle X‑ray scattering (SAXS) in transmission geometry to obtain ensemble‑average diameter and polydispersity with sub‑nanometer precision, especially useful for highly dense arrays that are challenging for SEM to resolve. All morphological data are statistically summarized (mean, standard deviation, skewness, and percentiles) and plotted as cumulative distribution functions, providing a quantitative benchmark for process control and supplier qualification.
Crystallinity, Phase Purity, and Strain State – HR‑XRD and Raman Spectroscopy
The wurtzite crystal structure, lattice strain, and phase purity of GaN nanowires directly influence their excitonic recombination and carrier mobility. Our high‑resolution X‑ray diffraction (HR‑XRD) system (PANalytical X'Pert MRD) equipped with a four‑crystal monochromator and a pixel detector performs ω‑2θ scans on nanowire ensembles to identify the (0002), (10‑10), and (10‑11) reflections, allowing us to extract the out‑of‑plane and in‑plane lattice constants with an accuracy of 0.001 Å. The full width at half maximum (FWHM) of rocking curves (ω‑scans) provides a quantitative measure of mosaic spread and dislocation density, with typical values below 200 arcsec for high‑quality nanowire arrays. We also perform reciprocal space mapping (RSM) around asymmetric reflections to distinguish between strained and relaxed regions, separating the contributions of the nanowire core, shell, and substrate interface.
For single‑nanowire crystallinity, we employ nanobeam electron diffraction (NBED) in a TEM with a probe size of 2 nm, which detects local lattice tilt, twist, and stacking faults. We complement this with micro‑Raman spectroscopy (Horiba LabRAM HR Evolution) using a 325 nm or 532 nm laser with a confocal spot size of 0.5 µm, measuring the E₂(high) and A₁(LO) phonon modes. The peak position and FWHM of these modes reveal the residual biaxial stress (via frequency shift) and the structural order (via linewidth broadening). We map these parameters across individual nanowires and along their length to detect any strain gradients due to compositional variations or substrate clamping – critical for understanding the efficiency of subsequent device processing.
Compositional and Dopant Profiling – From Ensemble to Single‑Wire Level
Alloy composition (e.g., In fraction in InGaN, Al fraction in AlGaN) and dopant concentration (Si for n‑type, Mg for p‑type) determine the emission wavelength, conductivity, and junction properties. Our chemical analysis suite begins with scanning TEM energy‑dispersive X‑ray spectroscopy (STEM‑EDS) in a probe‑corrected microscope (FEI Titan Themis), providing elemental maps with a spatial resolution of 1 nm, revealing the axial and radial distribution of Ga, In, Al, Si, and Mg. For statistical ensemble averages, we use X‑ray photoelectron spectroscopy (XPS) with in‑situ ion sputtering for depth profiling, quantifying the average surface composition and the thickness of native oxide layers. For dopant concentrations, we rely on secondary ion mass spectrometry (SIMS) (Cameca IMS 7f) with O₂⁺ and Cs⁺ primary beams, achieving detection limits of 1×10¹⁵ atoms/cm³ for Si and 5×10¹⁶ atoms/cm³ for Mg, with depth profiles extended to 1 µm. We carefully calibrate the SIMS data using ion‑implanted standards, ensuring that the measured doping levels are traceable.
For single‑nanowire composition, we employ atom probe tomography (APT) (LEAP 5000) on sharpened nanowire specimens, achieving 3D reconstruction of individual atoms and providing the most detailed information on compositional fluctuations, segregation at sidewalls, and interfacial abruptness. This capability is particularly valuable for characterizing quantum‑disks or superlattice structures within nanowires, where the sharpness of heterointerfaces governs the optical performance.
Surface Chemistry and Passivation Efficacy – XPS, ToF‑SIMS, and Workfunction Measurements
Surface states in GaN nanowires strongly affect Leakage Currents, recombination losses, and sensitivity to ambient gases. We perform high‑resolution XPS (Thermo Scientific K‑Alpha) to identify chemical shifts of Ga 3d, N 1s, O 1s, and adventitious C peaks, quantifying the relative fractions of Ga‑N, Ga‑O, Ga‑OH, and Ga‑N‑O bonds. This provides a direct measure of the native oxide thickness and the effectiveness of passivation layers (e.g., SiNₓ, Al₂O₃, HfO₂) deposited via ALD or plasma‑enhanced CVD. We complement XPS with time‑of‑flight SIMS (ToF‑SIMS) to map the lateral distribution of surface contaminants (Na, K, F, Cl) that may degrade electrical or optical stability. The surface work function is measured using Kelvin probe force microscopy (KPFM) in an AFM environment, providing the contact potential difference (CPD) that correlates with surface barrier heights and Fermi‑level pinning.
For environmental stability, we subject passivated and unpassivated nanowires to humidity‑temperature cycling (40 °C/85% RH for 500 hours) and re‑characterize the surface chemistry, quantifying any oxidation or delamination of the passivation layer. This information is critical for assessing the long‑term reliability of nanowire‑based photodetectors and sensors.
Electrical Transport and Photoconductivity – Single‑Nanowire and Ensemble Measurements
The electronic quality of GaN nanowires is reflected in their resistivity, free carrier concentration, mobility, and photoresponse speed. For ensemble measurements, we fabricate large‑area contact structures (using photolithography and e‑beam deposition) and perform current‑voltage (I‑V) measurements in a temperature‑controlled probe station (Cascade Summit) from 77 K to 500 K, extracting temperature‑dependent resistivity and deriving the activation energy of doping. We use the Hall effect (van der Pauw geometry) with a variable magnetic field (0–1.5 T) to determine the carrier concentration and mobility, with special attention to the anisotropy caused by nanowire orientation.
For single‑nanowire transport, we employ electron‑beam lithography (EBL) to define four‑probe contacts on individually selected nanowires, followed by low‑noise I‑V and four‑point probe measurements (using Keithley 6221 and 2182A) to eliminate contact resistance effects. We measure the field‑effect mobility by gating the nanowire through a back‑gate or a liquid‑ion‑gated electrolyte, providing insight into the surface conduction contribution and the effectiveness of surface passivation. We also measure photoconductivity under UV illumination (365 nm, 266 nm) as a function of intensity and bias, extracting the photocurrent gain, responsivity, and response/recovery times (down to 10 ns using a pulsed laser and a high‑speed oscilloscope) – parameters essential for UV photodetector applications.
Optoelectronic and Photoluminescence Characterization – Efficiency, Lifetime, and Stability
The optical performance of GaN nanowires is evaluated using photoluminescence (PL) and electroluminescence (EL) spectroscopy. Our PL setup consists of a 266 nm or 325 nm continuous‑wave laser, a cryostat (4‑300 K), a monochromator, and a photomultiplier tube (or InGaAs detector for NIR). We measure PL intensity, peak wavelength, and FWHM as a function of temperature (4 K to 300 K) to extract the exciton binding energy, localization effects, and non‑radiative recombination rates via Arrhenius analysis. The internal quantum efficiency (IQE) is estimated by comparing PL intensities at 4 K and 300 K, and we use power‑dependent PL to identify the dominant recombination mechanisms (e.g., excitonic, free‑carrier, or defect‑assisted). For EL, we fabricate nanoscale devices (e.g., p‑i‑n junctions) and measure the emission spectrum and power output as a function of current density, deriving the external quantum efficiency (EQE) and wall‑plug efficiency.
Time‑resolved PL (TRPL) is performed using a picosecond pulsed laser and a streak camera (time resolution of 20 ps) to measure the photoluminescence decay lifetime across different wavelengths and temperatures, revealing carrier dynamics and the influence of surface recombination. We compare the lifetimes for as‑grown, surface‑treated, and passivated nanowires to quantify the effectiveness of passivation in suppressing surface non‑radiative channels. For device reliability, we perform constant‑current aging (up to 1,000 hours) while monitoring the EL spectrum and intensity, and we analyze the degradation kinetics to determine the activation energy of failure modes (e.g., contact degradation, defect propagation, or surface oxidation).
Advanced Defect Microscopy – Dislocation, Stacking Fault, and V‑Defect Quantification
Despite the strain‑relaxed nature of nanowires, certain defects (basal stacking faults, partial dislocations, and inversion domains) can still form and degrade performance. We perform plan‑view and cross‑sectional TEM with bright‑field and weak‑beam dark‑field imaging to locate and classify defects, and we use g‑b analysis to determine Burgers vectors. For statistical defect density, we employ electron channeling contrast imaging (ECCI) in a SEM on uncoated nanowire arrays, which provides rapid, large‑area dislocation counting without requiring thin foil preparation. We also use cathodoluminescence (CL) mapping in a SEM at 5‑20 K to image the spatial distribution of luminescence intensity and spectral shifts, directly correlating defects with reduced optical output at the single‑nanowire level. Our CL system (Gatan MonoCL4) has a spatial resolution of 10 nm and can simultaneously acquire panchromatic and monochromatic images, revealing nanoscale variations in emission that are invisible in ensemble PL.
Thermal Management and Stability – Thermal Conductivity and Junction Temperature
For power devices, the thermal conductivity of GaN nanowires and their interfaces with the substrate are critical. We measure thermal conductivity using a suspended micro‑bridge method or the 3ω technique on nanowire arrays, achieving accuracy of ±10%. We also perform thermal resistance measurements on nanowire‑based LEDs using the forward‑voltage temperature coefficient (K‑factor) method, extracting junction temperature and the thermal impedance network (junction‑to‑ambient). The thermal stability of the nanowire structure is assessed by rapid thermal annealing (up to 1000 °C in N₂ or forming gas) followed by SEM, XRD, and PL characterization to detect any coalescence, decomposition, or stress relaxation that may limit the maximum processing temperature.
Our Distinctive Competencies – Correlative Multiscale and Physics‑Based Approach
What distinguishes our GaN nanowire testing service is the seamless integration of ensemble and single‑nanowire techniques, providing both statistical insight and mechanistic understanding. We are one of the few laboratories equipped with a complete chain – from high‑throughput SEM and automated image analysis to APT, high‑resolution TEM, and low‑temperature CL – all under one roof. This avoids the common pitfalls of sample transfer degradation and calibration mismatch. Our data analysis pipeline employs multivariate statistics (PCA, PLS) to correlate structural parameters (diameter, taper, defect density) with functional outcomes (PL intensity, carrier lifetime, sheet resistance), enabling rapid identification of the key limiting factors for your specific growth and process conditions.
Our scientific team includes PhD‑level researchers with backgrounds in III‑nitride epitaxy, nanophotonics, and device physics, allowing us to provide not just numbers but also interpretative insights – for example, identifying whether a low IQE is due to surface recombination, non‑radiative defects, or doping compensation, and recommending specific changes to growth temperature, V/III ratio, or passivation thickness. We offer customized test plans for emerging nanowire architectures (core‑shell, quantum‑disks, superlattices, and heterojunctions) and we actively participate in international round‑robins for nanowire characterization, ensuring that our results are comparable with leading research groups and industrial customers.
Our facility is ISO/IEC 17025 accredited for many of the key methods (SEM/EDS, XRD, XPS, PL, electrical I‑V), and we maintain rigorous calibration against NIST‑traceable standards. We offer rapid turnaround (3‑5 days for standard packages) and flexible sample handling, accepting wafer‑scale arrays, cleaved pieces, or TEM grids. We also provide consultancy on metrology development for new nanowire materials, such as GaN‑on‑graphene or GaN‑on‑Si with buffer layers, where existing standards are still evolving.
Comprehensive Service Modules – Tailored to Your R&D and Production Needs
We organize our testing into modular packages to provide maximum flexibility:
Module 1 – Morphological and Dimensional Analysis: SEM‑based diameter/length/density statistics, AFM topography, and FIB‑SEM 3D reconstruction – ideal for process monitoring and yield assessment.
Module 2 – Crystallinity and Strain State: HR‑XRD (ω‑2θ, rocking curves, RSM), Raman stress mapping, and NBED/TEM for single‑wire lattice analysis – essential for epitaxial quality control.
Module 3 – Composition and Doping Profiles: STEM‑EDS elemental mapping, XPS surface chemistry, SIMS depth profiling, and APT for 3D atom‑by‑atom reconstruction – critical for alloy homogeneity and dopant control.
Module 4 – Electrical and Photoconductivity Characterization: Ensemble I‑V, Hall effect, and single‑wire four‑probe measurements with temperature and gate dependence – for transport property evaluation.
Module 5 – Optical and Luminescence Assessment: PL, EL, TRPL, and CL (spectral and spatial maps) with variable temperature (4‑300 K) – for efficiency and degradation analysis.
Module 6 – Defect Imaging and Density Quantification: Plan‑view and cross‑sectional TEM, ECCI, and CL‑based defect spectroscopy – for reliability and failure precursor identification.
Module 7 – Thermal and Environmental Stability: Thermal conductivity, junction temperature measurement, and accelerated aging (temperature, humidity, current stress) – for device lifetime prediction.
Module 8 – Comprehensive Nanowire Qualification Package: All modules combined into a single project, with full data integration, statistical correlation, and a final interpretive report – suitable for technology validation, supplier approval, or publication support.
We accept samples in any form – as‑grown on substrate, transferred onto TEM grids, or processed devices. Minimum sample area is 1 mm², and we can work with as few as 10 nanowires for single‑wire measurements, though statistical relevance demands larger ensembles for module 1 and 2.
Data Integrity, Security, and Reporting
All data are collected under strict SOPs, with fully traceable instrument calibrations. Our electronic data management system (LIMS) records operator, timestamp, and environmental conditions. We provide raw data files, metadata, and processed results in a structured format (Excel, CSV, and PDF), with detailed uncertainty statements where applicable. Confidentiality is guaranteed through NDAs, and data are stored on encrypted servers with role‑based access. We can also deliver interactive reports with embedded 3D visualizations of compositional or tomographic data for easy interpretation.
Client Engagement and Workflow
We start with a free consultation to define your nanowire type, critical parameters, and specific concerns (e.g., sidewall roughness, non‑uniform doping, or rapid degradation). We then propose a tailored plan, including a fixed price and timeline. Upon sample receipt, we perform incoming inspection and log the sample. Testing proceeds in parallel, with clients receiving progress updates through a secure portal. The final deliverable includes a comprehensive report, data tables, graphs, and an executive summary with recommended next steps. A post‑project review meeting is available to discuss the findings and integrate them into your development roadmap.
Conclusion – Empowering Your GaN Nanowire Innovations with Unmatched Analytical Depth
GaN nanowires represent a paradigm shift in semiconductor device design, but their successful transition from research to production demands a multiscale, correlative, and quantitative understanding of their structural, electrical, optical, and thermal properties. Our comprehensive testing service delivers exactly that – a one‑stop, ISO‑accredited solution that bridges the gap between growth parameters and device performance. With our advanced instruments, expert team, and client‑centric engagement, we provide not only accurate data but also the physical insight needed to accelerate yield improvement, extend device lifetime, and achieve competitive differentiation. Whether you are developing high‑efficiency micro‑LEDs, UV photodetectors, or high‑frequency power transistors, our service equips you with the diagnostic power to succeed.
We invite you to contact our nanowire characterization specialists to discuss your specific requirements. Let us help you unlock the full potential of your GaN nanowire technology – from the atomic structure to the system‑level reliability. Your journey to nanowire excellence begins with our rigorous, integrative, and actionable testing.