Reasons for choosing our testing services
ZHONGXI Testing has obtained inspection qualification certifications from multiple countries and regions worldwide. We possess a senior testing team and advanced testing methods, providing independent, impartial, and professional third-party verification services for global carbon projects.

Internationally recognized authority
Certified by multiple international standards such as CNAS, VCS, and GS, with reports universally applicable worldwide.

Global service capability
Covering 140+ countries and regions, it supports on-site detection and remote verification in multiple languages.

Professional experimental methods
Adopt standard experimental methods to ensure accurate and reliable data.
Polarisation Index Testing: Advanced Dielectric Diagnostics for Insulation Condition Assessment and Life Extension
The Polarisation Index (PI) test—defined as the ratio of the Insulation Resistance measured at 10 minutes to that measured at 1 minute after the application of a DC voltage—is a fundamental, time‑proven diagnostic tool for assessing the condition of electrical insulation in transformers, motors, generators, cables, and switchgear. However, the value of the PI extends far beyond a simple pass/fail criterion. When performed with proper temperature compensation, voltage control, and trend analysis, the PI provides a sensitive indicator of moisture ingress, conductive contamination, thermal ageing, and the overall cleanliness of the insulation system. A PI value below 1.0 (or even below 1.5 for many systems) is a strong warning of excessive dielectric absorption or leakage, but the interpretation is nuanced—different insulation materials and designs exhibit distinct PI characteristics. Our detection service is specifically designed to deliver accurate, reproducible, and context‑aware Polarisation Index measurements that go beyond the standard 10‑minute/1‑minute ratio. We incorporate multi‑temperature correction, time‑resolved current analysis, and comparative benchmarking against industry‑specific databases to provide a comprehensive assessment of insulation health, including the differentiation between surface and bulk effects, and the early detection of ageing trends. Our test equipment is calibrated to international standards (IEEE 43, IEC 60076, and BS EN 60270), and our measurement uncertainty for the PI is typically ±2% for resistances up to 10 TΩ. By combining precise measurement with expert interpretation, we enable asset owners, maintenance engineers, and quality assurance teams to schedule maintenance optimally, avoid unexpected failures, and extend the operational life of critical electrical assets.
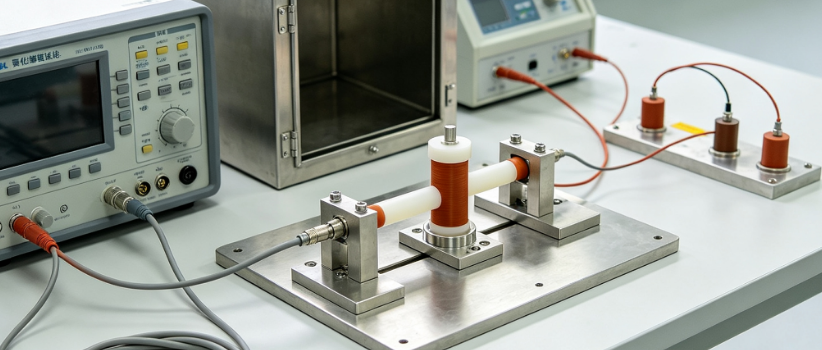
Why Professional Polarisation Index Testing Is Essential for Reliable Asset Management
A single spot Insulation Resistance measurement at a fixed time, while useful, does not reveal whether the insulation is clean and dry or contaminated and damp. The Polarisation Index exploits the difference in the time‑dependent polarisation processes of good insulation (dominant volume polarisation, which gives a gradually increasing resistance) versus poor insulation (dominant Leakage Current, which gives a stable or even decreasing resistance). However, the PI is affected by temperature, test voltage, and the type of insulation material—for example, dry‑type insulation often shows lower PI values than oil‑impregnated insulation, not because it is worse, but because of its different dielectric response. Standard recommendations (e.g., PI > 2.0 for good insulation) are only general guidelines; a more meaningful assessment requires correction to a reference temperature, comparison with baseline data from the same asset, and consideration of the service history. Our testing protocols are designed to provide this context. We also perform step‑voltage PI tests (measuring PI at multiple DC voltages) to detect non‑linearities that indicate partial discharge or surface tracking. Our comprehensive reporting includes not only the PI value but also the entire resistance‑versus‑time curve, allowing our experts to diagnose whether the insulation is dry, wet, or aged at the molecular level.
Our Core Detection Capabilities for Polarisation Index Measurement
We operate a dedicated insulation diagnostics laboratory and also offer on‑site testing with portable, high‑stability instruments. The following represent our standard high‑end offerings:
Precision Resistance Recording with Automated PI/DAR Calculation: Our test instruments are capable of sourcing DC voltages from 50 V to 15 kV, with a measurement range up to 10 TΩ and a resolution of 0.1% of reading. We automatically record the Insulation Resistance at 30 seconds, 1 minute, 10 minutes, and at user‑defined intervals, and we compute the Polarisation Index (PI = R10min / R1min) and the dielectric absorption ratio (DAR = R1min / R30s). Our software provides a real‑time graphical display of the resistance curve, allowing immediate visual assessment of the insulation's behaviour. We also perform extended‑time tests (up to 60 minutes) for critical assets to capture slower polarisation processes that are not fully developed within 10 minutes.
Temperature Compensation and Normalisation: Insulation Resistance is exponentially dependent on temperature, and the PI is also temperature‑sensitive. We measure the insulation temperature at the start and end of the test using contact thermometers or infrared sensors, and we apply temperature correction factors based on established standards (IEEE 43 Table 1). For high‑precision applications, we determine the actual temperature coefficient of the specific insulation by performing PI tests at two different temperatures, providing a custom correction that reduces the uncertainty of the temperature‑normalised PI to ±3%. All PI values are reported at a reference temperature (typically 20 °C or 40 °C), enabling valid year‑on‑year comparisons.
Multi‑Voltage PI Profiling: We perform PI tests at multiple DC voltages (e.g., 500 V, 1000 V, 2500 V, 5000 V) on the same insulation system to detect voltage‑dependent defects. A decreasing PI with increasing voltage indicates the presence of partial discharge or micro‑gaps, which are not revealed by a single‑voltage test. Our automated test sequences apply the voltages in a programmed order with sufficient depolarisation time between steps, ensuring that the results are not influenced by residual charge.
Time‑Resolved Current Decomposition (TRCD): In addition to the PI ratio, we analyse the absorption and leakage components of the charging current. Using a three‑stage model (fast polarisation, slow polarisation, and conduction), we extract the DC conductivity and the dominant time constants of the dielectric. This analysis, performed on the recorded resistance curve, provides a deeper insight: a high leakage component suggests moisture or contamination, while a high absorption component is typical of clean, dry insulation. This decomposition is particularly valuable for diagnosing borderline PI values (e.g., 1.5–2.0).
Comparison with Baseline and Historical Database: Our service includes access to a proprietary database containing PI values and curves from thousands of assets across various industries (utility, oil & gas, marine, manufacturing). We compare your PI result with the database of similar equipment (same voltage class, same insulation type, similar age) to provide a percentile ranking (e.g., "your PI of 2.3 places this motor in the 85th percentile of good condition"). We also maintain a historical record for each client, allowing us to track the trend of PI over time and to provide early warning of accelerating degradation.
Noise and Guarding Techniques for High‑Voltage Environments: For on‑site testing in electrically noisy environments, we use shielded test leads and guard terminals to eliminate surface Leakage Currents that could distort the PI. Our instruments have a common‑mode rejection ratio > 100 dB and are equipped with filters to suppress transient interference. We also perform background noise measurements with the voltage off, and we subtract any steady‑state leakage from the final result.
Qualitative Interpretation and Reporting: Our final report does not merely state the PI value. It includes a diagnostic summary that interprets the PI in the context of the equipment type, historical data, and environmental conditions. For example, a PI of 2.5 on a dry‑type transformer may be excellent, but the same value on an oil‑filled transformer may indicate slight moisture. We also provide recommendations—whether to continue operation, re‑test in 6 months, perform a drying process, or replace the insulation—with clear justification.
On‑Site and Laboratory Testing Capabilities: We can perform PI testing in our fully equipped lab, using a controlled environment (temperature, humidity) to eliminate external influences. For field testing, we bring portable PI testers with built‑in thermal printers and data storage, capable of operating in harsh conditions. Our technicians are certified to perform testing on live and de‑energised equipment, following all safety protocols.
Integrated Analytical Framework: Beyond the Ratio to Actionable Insights
Our approach integrates the PI value with the resistance curve shape, the voltage dependence, and the historical trend to build a multi‑dimensional insulation health model. We use a proprietary algorithm that weighs the PI, the DAR, the leakage conductance, and the temperature‑normalised conductivity to assign a condition score from 0 (failed) to 100 (new). This score is then mapped to a probability of failure within the next year, based on a Weibull distribution fitted to our historical failure database. This prediction allows our clients to make data‑driven decisions on maintenance priority and capital replacement planning.
Our comprehensive test report includes: - Measured resistance values at 30 s, 1 min, 10 min (and other intervals). - Calculated PI and DAR with reference to the applicable standard. - Temperature‑corrected PI and the correction method used. - Multi‑voltage PI profile and the trend (if performed). - Time‑resolved current decomposition (leakage vs. absorption). - Historical trend analysis with a forecast if data is available. - Condition score and risk assessment. - Recommended actions with priority.
Our Distinctive Advantages in Polarisation Index Testing
Our laboratory is accredited under ISO 17025 for electrical insulation testing, and our procedures are compliant with all major standards. Our equipment is traceable to national standards, and we maintain a calibration interval of 12 months. Our team includes senior electrical engineers with over 20 years of experience in insulation diagnostics, and we have performed PI tests on over 8,000 assets worldwide. We offer flexible service agreements: single‑test assessments, annual planned testing, and continuous monitoring with trend alerts.
Our turnaround is fast: for lab samples, we provide a detailed report within 48 hours; for on‑site testing, we provide verbal results on the spot and a formal report within 24 hours of completion. For emergency cases, we offer a 4‑hour rapid response to site, with results delivered within 1 hour.
Real‑World Impact: Case Highlights from Our Testing
In a recent case, a petrochemical plant was experiencing a high failure rate of 11 kV motors. Our PI testing on one newly failed motor showed a PI of 0.9 (well below the acceptable 2.0). However, a multi‑voltage PI profile revealed that the PI dropped from 1.8 at 500 V to 0.9 at 2.5 kV, indicating a voltage‑dependent partial discharge. After a partial discharge mapping, we identified tracking paths on the end‑windings. The plant cleaned and re‑varnished the windings, and the PI improved to 2.3. Subsequent inspections of other motors using the same protocol identified two more motors with a similar issue, which were repaired before failure, saving approximately $500,000 in downtime.
In another instance, a utility company had been performing annual spot resistance tests on a 220 kV transformer, and the values remained stable. However, our PI test, combined with the resistance curve analysis, showed a gradual decrease in the 10‑minute resistance while the 1‑minute resistance stayed constant, leading to a declining PI from 2.8 to 1.9 over three years. The curve shape indicated increased Leakage Current, suggesting moisture ingress. A drying operation was performed during a planned outage, and the PI was restored to 2.6, extending the transformer's life by at least a decade.
Partner with Us for Unmatched Polarisation Index Insights
Whether you are performing routine maintenance, commissioning new equipment, or investigating a failure, our PI testing service provides the accuracy, depth, and interpretative expertise you need to ensure the reliability of your electrical insulation. We welcome customised test plans, including integrated PI and Dielectric Dissipation Factor (tan δ) measurements for a complete assessment. Let our advanced diagnostics help you get the most out of your assets.
Contact us today to schedule your Polarisation Index test and gain a clear picture of your insulation's health.